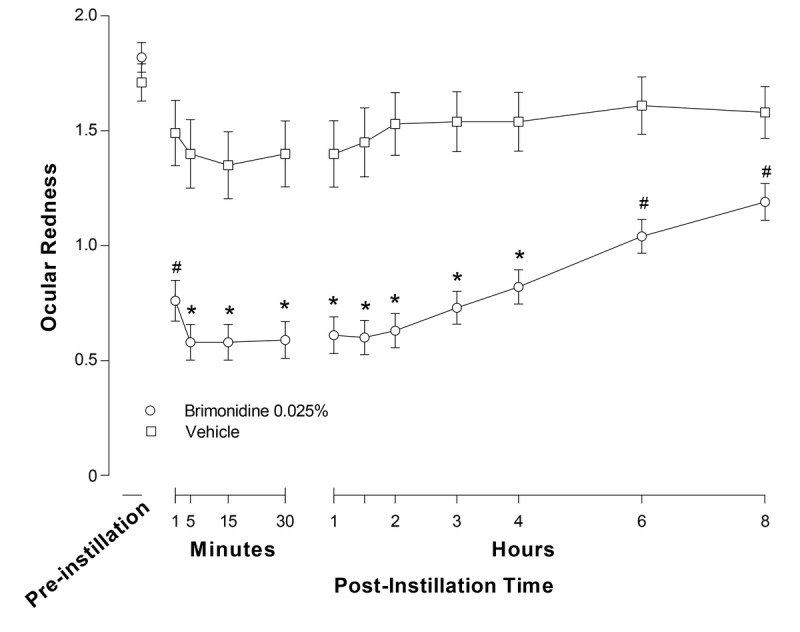
FIGURE 1.

Investigator-evaluated ocular redness (0- to 4-unit scale) at day 1 by treatment in the intent-to-treat (ITT) population. Data are means (SE); *P < .0001 vs. vehicle at the indicated time point (last observation carried forward); #P ≤ 0.01 vs. vehicle at the indicated time point (observed data only).
