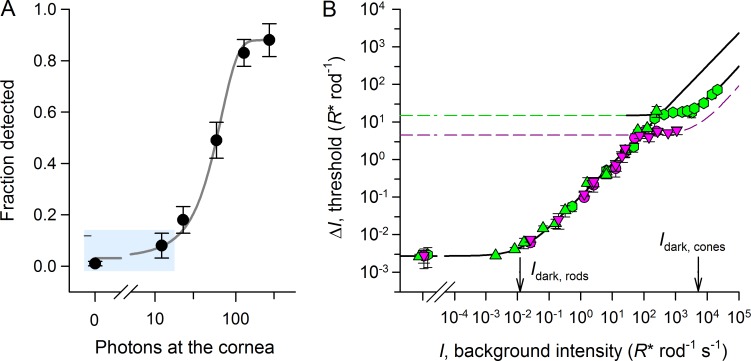
Figure 1.
Selected results from a mouse behavioral study of visual threshold (modified from Naarendorp et al., 2010). (A) Frequency of seeing curve. Data represent 1,369 trials collected in which a mouse running on a wheel had to detect a <1 ms, 500 nm target of varied energy subtending 5° of visual angle on the ventral retinal. Flashes were presented at random times while the mouse was running on a wheel, and the mouse was rewarded with access to water if it exited the wheel in less than one revolution after the presentation. Error bars are ±2 SEM and thus approximate 95% confidence intervals. The data point plotted at zero represents stimulus-null trials and thus estimates the false positive rate, 1.0%. The light blue rectangle highlights the highly reliable difference (P < 0.0001) between the false positive rate (1%) and the detection rate (8%) for the lowest stimulus energy, 11 photons, discussed in the section "A single photon can occasionally be detected . . ." (B) Dark and increment threshold curves of mice for 365-nm (purple) and 510-nm (green) flashes in the presence of backgrounds of varied intensity, specified in R* units. The smooth curves plot the generalized Weber-Fechner relation, where I is the background intensity, ΔI is the threshold, ΔI0 is its value in darkness, Idark is the dark light or Eigengrau level, and n = 0.9 is the slope of the linear portion of the log–log plot of the curves. For the lower curve, the 365-nm and 510-nm data are coincident with the abscissa expressed in rod R* units, indicating that rods provide the signals for detection with backgrounds producing up to ∼100 R* rod−1 s−1. The breaks in the curve reveal the points at which cone vision for the two wavelength test flashes becomes more sensitive than rod vision. The value of the rod dark light Idark corresponds exactly to the spontaneous rate of rhodopsin isomerization, 0.012 s−1, measured by Burns et al. (2002) in suction electrode recordings from mouse rods. The lower branch of the increment threshold curve reveals that signaling via SPRs dominates most of the background intensity range over which rod-generated vision is more sensitive than that of cones; because the normal SPR has a duration of ∼200 ms, backgrounds of up to 5 R* rod−1 s−1 represent conditions when all visual information is carried by SPRs.

