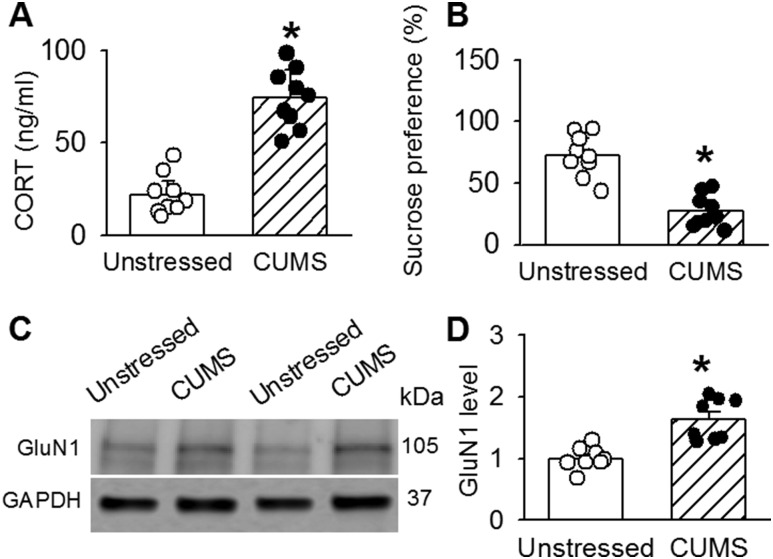
Figure 2.
CUMS increases the protein levels of NMDAR subunits in the PVN. Summary data of (A) CORT levels and (B) sucrose preference before and after CUMS (n = 8 in each group). (C) Representative Western immunoblot gel images and (D) quantification of band density show the protein levels (normalized to GAPDH) of GluN1 in PVN tissue in unstressed rats and CUMS rats (n = 8 samples in each group). The molecular weights are indicated to the right of the gel images. *P < 0.05 compared with the value in unstressed rats (unpaired t test).

