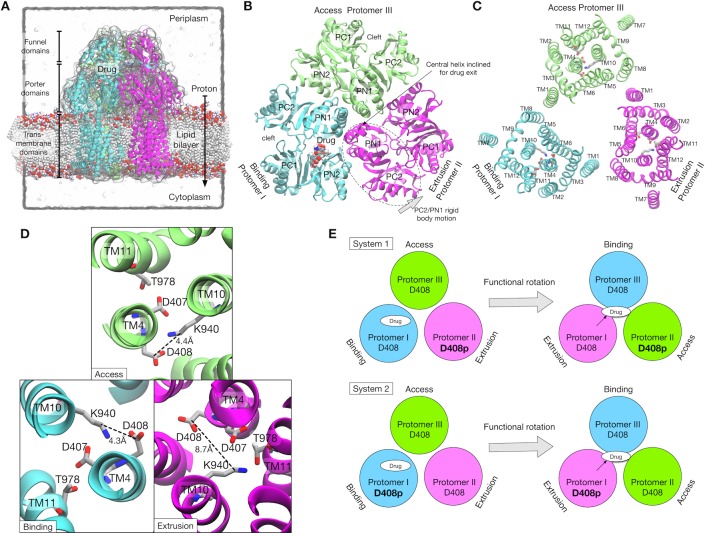
Figure 1. Crystal structure of AcrB and simulation setup.
(A) Simulation box and a side view of AcrB embedded in a palmitoyloleoyl phosphatidylethanolamine (POPE) lipid bilayer. A drug (minocycline) is represented by spheres. (B) Porter domains of the crystal structure viewed from the cell exterior. The protomers in cyan, magenta and lime represent the Binding, Extrusion, and Access states, respectively. (C) The transmembrane domain viewed from the cell exterior. Key residues that are related to proton translocation are represented by sticks. (D) Close-up view of the key residues. (E) Schematics of the simulation systems. The protonated D408 is denoted by D408p. System 1 has D408p in the Protomer II. System 2 has D408p in the Protomer I.

