. 2018 Mar 6;7:e31715. doi: 10.7554/eLife.31715

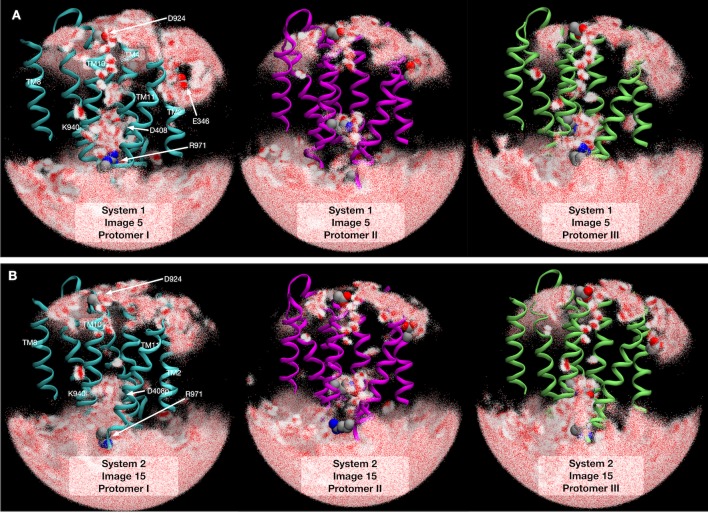
Figure 3. Electrostatic features and water molecule distributions in the transmembrane region.

(A) Representative structure of transmembrane helices 4, 10 and 11 for protomer I (cyan) of system 1 at image 5 drawn with cartoons. Deprotonated/protonated D408, K940 and R971 are represented by spheres. Averaged electrostatic potential isosurfaces are drawn in blue (corresponding to the isovalue of 0.06 kcal/mol) and red (−0.06 kcal/mol). (B) After transforming the protonation state toward system 2. (C) System 2 at image 15. For comparison, the helices of image 5 are drawn in gray. (D) 2500 snapshots of water atoms are drawn with red points (oxygen) and white points (hydrogen) for protomer I of system 1 at image 5. Key residues (L400, D924, T933, L937, K940, F982 and R971) are drawn with spheres. (E) System 2 at image 15. For comparison, the helices of image 5 are drawn in gray.

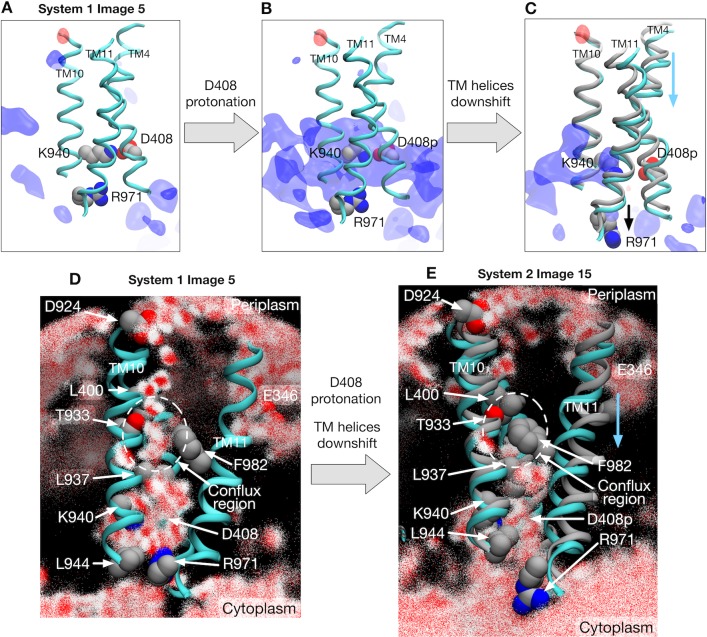
Figure 3.

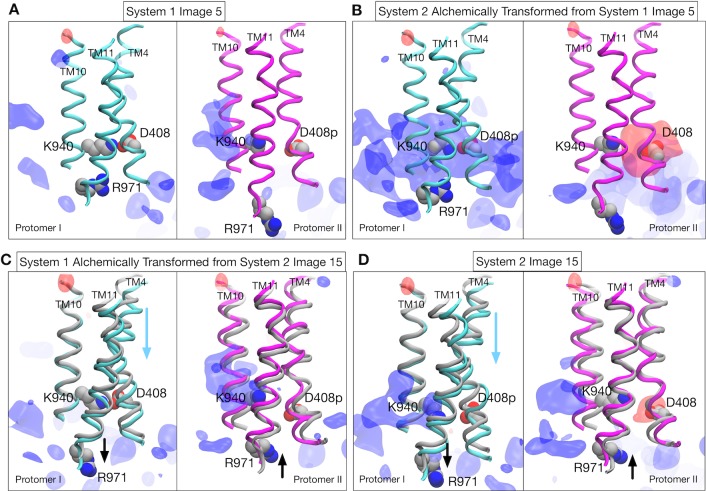
Figure 3—figure supplement 1. Structural changes and electrostatic features in the transmembrane region.

Figure 3—figure supplement 1.

Representative structure of transmembrane helices 4, 11 and 10 for protomer I (cyan) and II (magenta) drawn with cartoons. Deprotonated/protonated D408, K940 and R971 are represented by spheres. Averaged electrostatic potential isosurfaces are drawn in blue (corresponding to the isovalue of 0.06 kcal/mol) and red (−0.06 kcal/mol). (A) Image 5 of system 1. (B) System 2 that is alchemically transformed from image 5 of system 1. (C) System 1 that is alchemically transformed from image 15 of system 2. For comparison, the helices of image 15 (gray) are drawn with those of image 15 (cyan and magenta). (D) Image 15 of system 2.
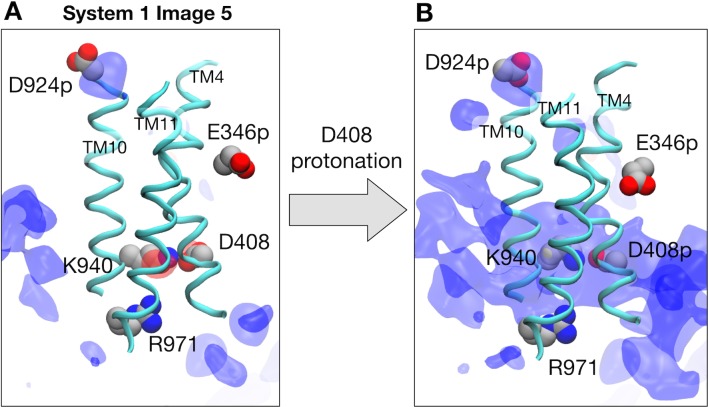
Figure 3—figure supplement 2. Electrostatic features with protonated D924 and E346.

Figure 3—figure supplement 2.

(A) Representative structure of transmembrane helices 4, 10 and 11 for protomer I (cyan) at image 5 of system 1 are drawn with cartoons. Deprotonated D408, K940, R971, protonated D924, and protonated E346 are represented by spheres. Averaged electrostatic potential isosurfaces are drawn in blue (corresponding to the isovalue of 0.06 kcal/mol) and red (−0.06 kcal/mol). (B) After protonating D408 toward system 2.
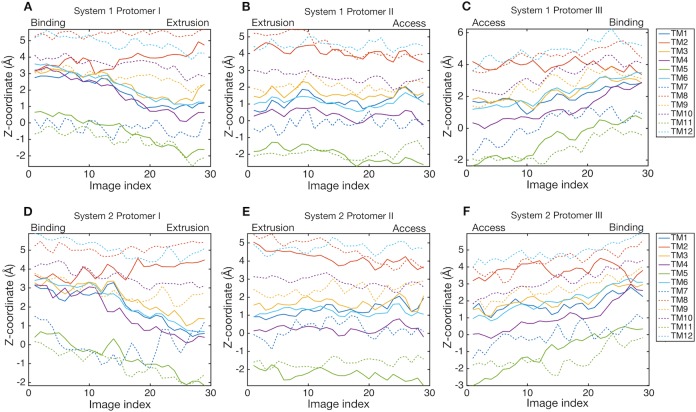
Figure 3—figure supplement 3. Downshift and upshift motions of transmembrane helices.

Figure 3—figure supplement 3.

Z-coordinates of center-of-masses of transmembrane helices are plotted as a function of image index. Line colors indicate transmembrane helices. Solid lines are helices in the R1 repeat (except for TM2), and broken lines are in the R2 repeat (except for TM8).
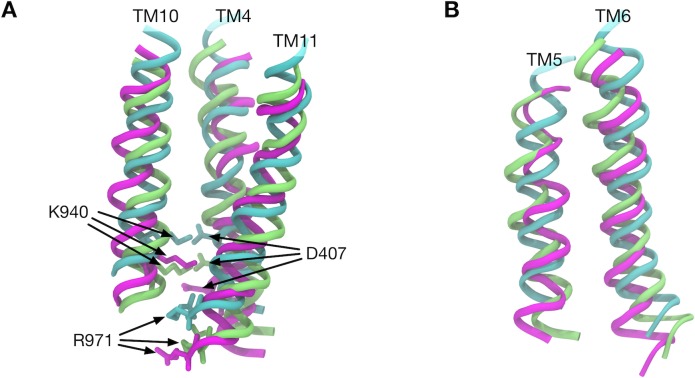
Figure 3—figure supplement 4. Comparison of transmembrane helix positions in the crystal structure.

Figure 3—figure supplement 4.

(A) Transmembrane helices 4, 10 and 11 in the Binding (cyan), Extrusion (magenta) and Access (lime) states are superimposed. (B) Transmembrane helices 5 and 6 are superimposed. Here, we first defined the z-axis from the minor principal axis of the completer AcrB trimer of the crystal structure (PDB entry: 4DX5). Then, the transmembrane helices of different states were superimposed. The least-squares fittings of structures were performed only in the xy-plane and z-coordinates were kept.
Figure 3—figure supplement 5. Water molecule distributions in transmembrane domain.

Figure 3—figure supplement 5.

2500 snapshots of water atoms are drawn with red points (oxygen) and white points (hydrogen) at (A) image 5 of system 1 and (B) image 15 of system 2. Cyan indicates the protomer I (Binding → Extrusion), magenta indicates the protomer II (Extrusion → Access), and lime indicates the protomer III (Access → Binding).