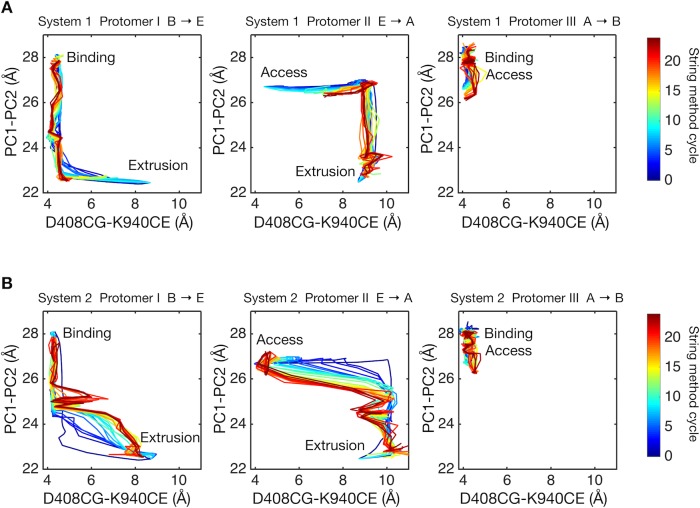
Figure 4. Two-dimensional visualization of conformational pathways.
(A) Conformational pathways of system 1 are monitored by distance between the Cγ-atom of D408 and the Cε-atom of K940 (illustrated in Figure 1D), and by the center-of-mass distance between the PC1 and the PC2 subdomains. These quantities are deterministic because they are involved in the collective variables used with the string method calculation. Dark blue lines indicate the initial pathway generated by the targeted MD simulations. Dark brown lines are the final converged pathways obtained by the string method. (B) Conformational pathways of system 2.

