. 2018 Mar 6;7:e31715. doi: 10.7554/eLife.31715

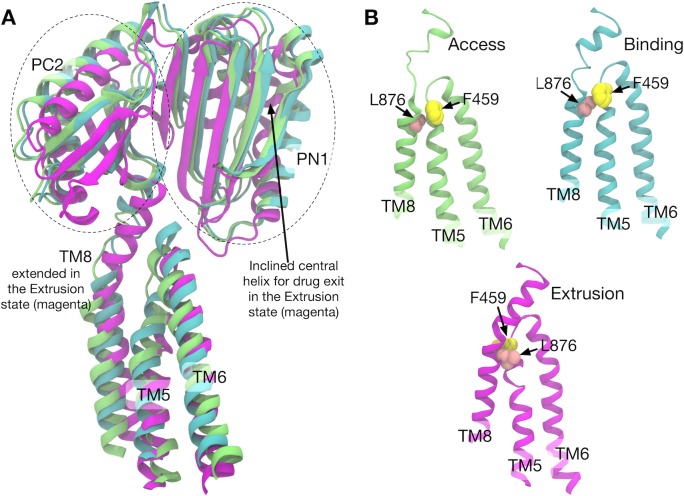
Figure 5. Comparison of the structures of transmembrane helices 8, 5, 6 and porter subdomains PC2 and PN1 in the crystal structure.

(A) Side view of TM8, TM5, TM6 and porter subdomains PC2 and PN1 in the Binding (cyan), Extrusion (magenta) and Access (lime) states, in which the structures are superimposed. (B) Relative positions of F459 (yellow) on TM5 and L876 (pink) on TM8 are compared in different states.

Figure 5.

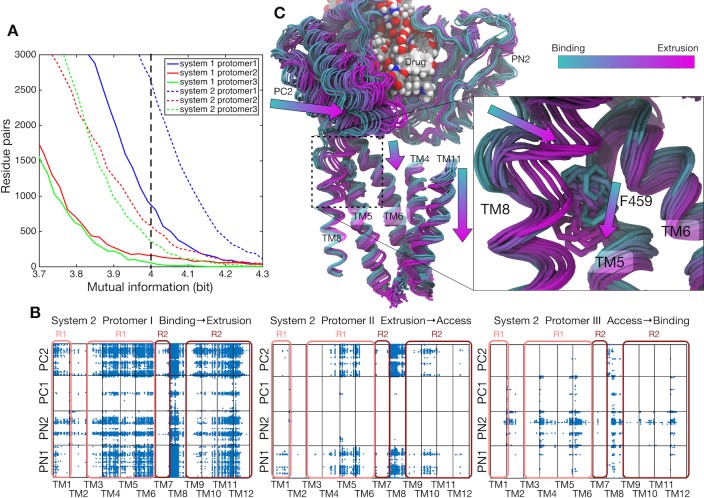
Figure 5—figure supplement 1. Correlations between the transmembrane helices and the porter domain motions.

Figure 5—figure supplement 1.

(A) Number of residue pairs between TM helices and the porter domain as a function of mutual information for each protomer of systems 1 and 2. (B) Correlated residue pairs between TM helices and the porter domain evaluated by mutual information along the minimum free energy pathway of system 2. Each blue dot represents a highly correlated residue pair with mutual information greater than 4.0 bit (indicated by the black broken line in the panel [A]). (C) Representative snapshots of protomer I along the conformational pathway of system 2. PN2 and PC2 on the porter domain, TM4–TM6, TM8 and TM11 on the TM domain, and the drug are shown. According to the image index, the color of the structure changes from cyan (corresponding to the B state) to magenta (the E state). F459 on TM5 and the drug are represented by sticks and spheres, respectively.
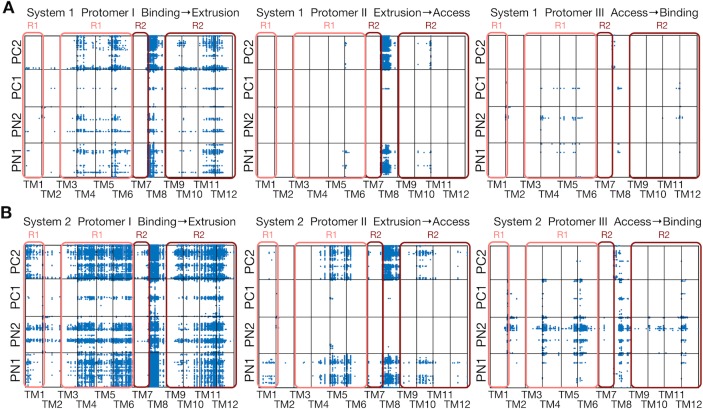
Figure 5—figure supplement 2. Comparison between systems 1 and 2.

Figure 5—figure supplement 2.

(A) Correlated residue pairs between TM helices and the porter domain evaluated by mutual information along the minimum free energy pathway of system 1. Each blue dot represents a correlated residue pair whose mutual information is greater than 4.0 bit. (B) The same plot for system 2.