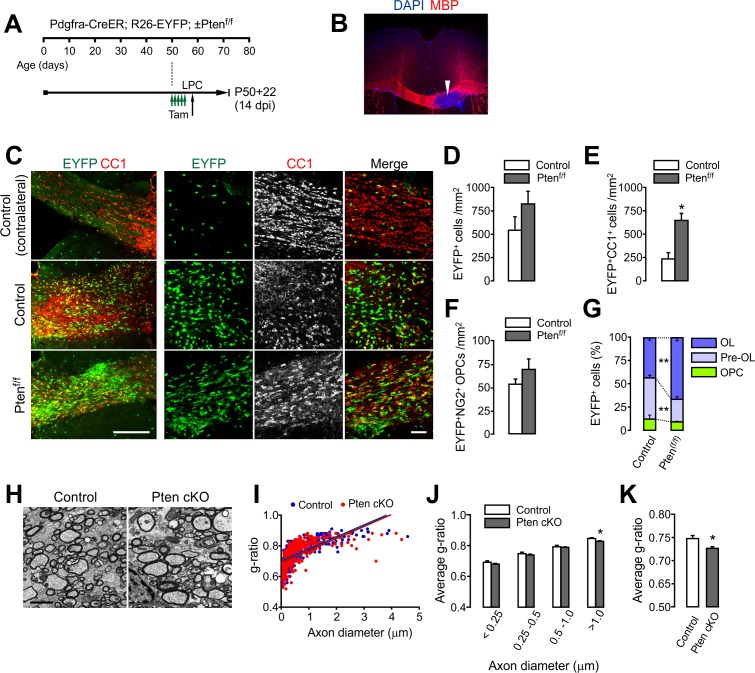
Figure 6. OPC-specific Pten ablation facilitates oligodendrocyte regeneration and remyelination after LPC-induced demyelination.
(A) Experimental scheme for tamoxifen (Tam) and lysolecithin (LPC) injection into Pdgfra-CreER; R26-EYFP; ±Ptenf/f mice. A series of tamoxifen injections (40 mg/kg per i.p. injection, a total of 10 injections) were given between P50 and P54. The demyelination was induced with LPC injection at P58, and the mice were sampled at P72, which is 14 days after LPC injection (14 dpi), and 22 days after the first tamoxifen injection (P50 +22). (B) Loss of MBP immunoreactivity (arrowhead) at the LPC-injected CC in the brain. (C) Fluorescence (left) and confocal (right) images of EYFP+ cells and CC1+ OLs in the CC at 14 days after LPC injection (14 dpi). Scale bars, 200 μm (left) and 50 µm (right). (D) Quantification of EYFP+ cells in the LPC injected site at 14 dpi. (E) Quantification of EYFP+CC1+ OLs. (F) Quantification of EYFP+NG2+ OPCs. (G) Pten cKO mice exhibited marked changes in the percentage of OL and pre-OL among EYFP-labeled cells at the LPC-injected areas at 14 dpi. (H) Representative EMs of the lesion in the CC at 14 dpi. Scale bar, 2 μm. (I) Scatter plot for individual g-ratios of myelinated axons. More than 100 myelinated axons per mouse, and three mice per group were analyzed. (J, K) Average g-ratio according to axon diameter (J) and as a total (K). Data are represented as mean ±S.E.M. n = 3 (control) or 5 (Pten cKO) mice for (D - G), or n = 3 per group for (H–K). *p<0.05; **p<0.01. Unpaired Student's t-test. The numerical data for the graphs are available in Figure 6—source data 1.


