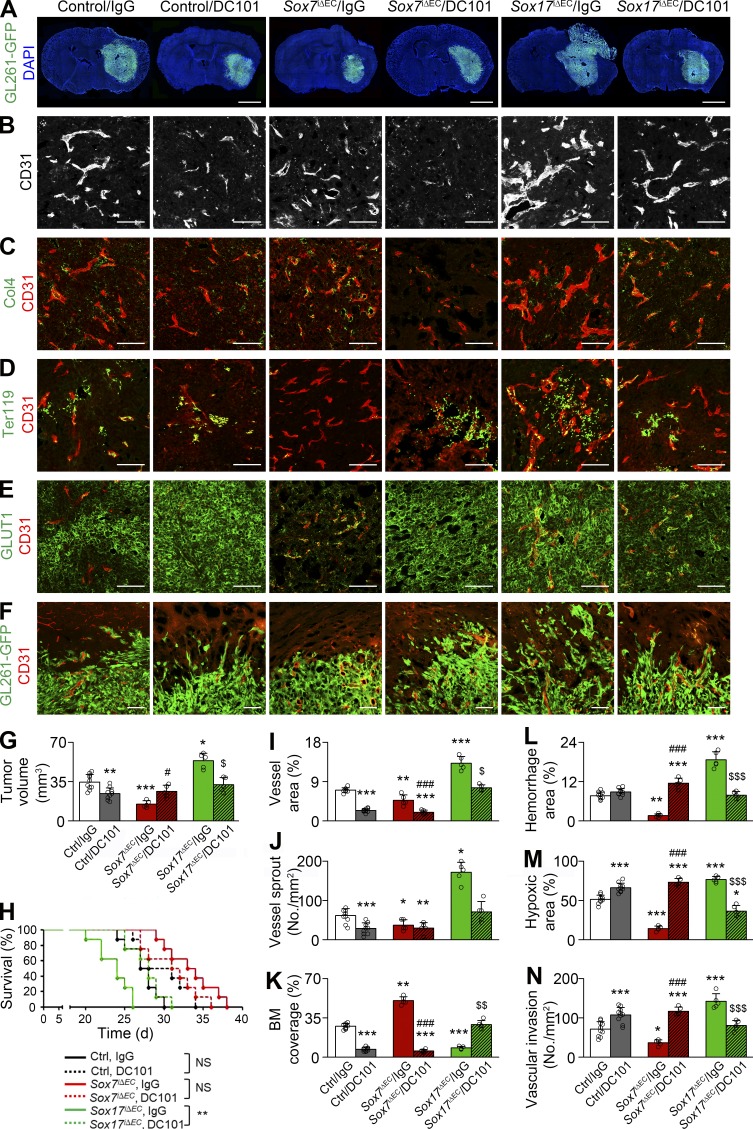
Figure 8.
Vascular and tumor responses to VEGFR2 inhibition are variable according to Sox7 levels in HGG vessels. Control (Ctrl), Sox7i△EC (S7KO), and Sox17i△EC (S17KO) mice bearing HGG were administered with control (IgG) or α-VEGFR2 (DC101) Ab. (A) GL261-GFP HGGs. (B–F) CD31-positive HGG vessels. (B) Vascular network. (C) Col4-positive basement membrane (BM). (D) Ter119-positive erythrocytes. (E) GLUT1 immunostaining. (F) Invasion of GL261-GFP tumor cells at the tumor periphery. (G) Quantification of tumor volume in A. (H) Survival curves for HGG-bearing mice (n = 8). (I and J) Quantification of vessel area (I) and sprouts (J) in B. (K) Quantification of coverage in C. (L) Quantification of hemorrhage in D. (M) Quantification of hypoxic area in E. (N) Quantification of perivascular invasion in F. Values are presented as mean ± SD (n = 5 unless otherwise denoted). *, P < 0.05; **, P < 0.01; ***, P < 0.001 versus control/IgG; #, P < 0.05; ###, P < 0.001 versus Sox7iΔEC/IgG; $, P < 0.05; $$, P < 0.01; $$$, P < 0.001 versus Sox17iΔEC/IgG (log-rank test). NS, not significant. Bars: 2 mm (A); 100 µm (B–F).

