Figure 3.
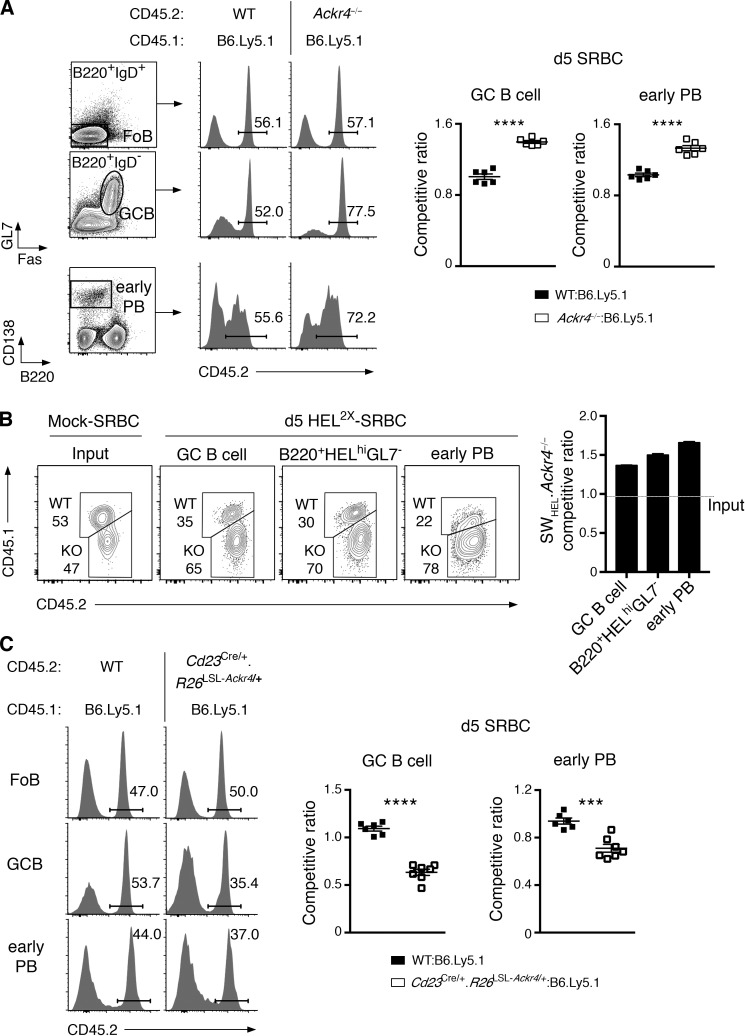
ACKR4 limits early B cell responses in a B cell–intrinsic manner. (A) Mixed BM chimeras were generated with an equal mixture of B6.Ly5.1 (CD45.1) and WT or Ackr4−/− (both CD45.2) BM. Representative plots of CD45.2+ cells among Fo B cells (B220+IgD+Fas−GL7−), GC B cells (B220+IgD−Fas+GL7+), and early PBs (B220lo/-CD138+) 5 d after SRBC. Gating of these populations is shown. Competitive ratios of GC B cells (left graph) and early PBs (right graph) are plotted as the frequencies of CD45.2+ cells in each compartment, normalized to the frequencies of CD45.2+ cells in the concurrent Fo B cell compartment. n = 6 mice/genotype (means ± SEM). (B) WT (CD45.1/2) and Ackr4−/− (CD45.2) SWHEL B cells were cotransferred into B6.Ly5.1 (CD45.1) mice and immunized with HEL2X-SRBC (n = 4 mice) or mock-conjugated SRBCs (n = 3 mice). Contribution of WT and Ackr4−/− cells to SWHEL GC B cell (B220+Igκ+HELintGL7+CD138−), early PBs (B220lo/-Igκ+HEL+CD138+), and B220+HELhiGL7− (also Igκ+CD138−) cell populations 5 d after immunization. The SWHEL.Ackr4−/− competitive ratio is plotted as the ratio of Ackr4−/− to WT among SWHEL effector cell compartments from day 5 HEL2X-SRBC–immunized mice, normalized to the input ratio (as determined from mock-SRBC immunized mice analyzed on day 5 [means ± SEM]). (C) Cd23Cre/+.Rosa26LSL-Ackr4/+ mixed BM chimeras were generated and analyzed as in A (n = 6–7 mice/genotype; mean ± SEM). (A–C) Data are representative of two (B and C) and three (A) independent experiments. Two-tailed, unpaired Student’s t test. ***, P < 0.001; ****, P < 0.0001.

