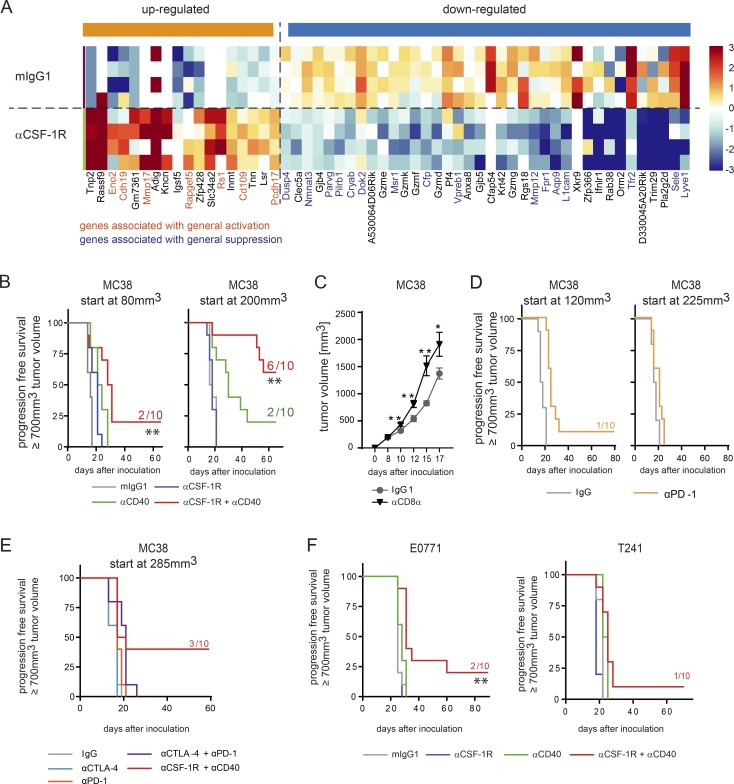
Figure 1.
Combination of CSF-1R inhibition and αCD40 treatment leads to rejection of MC38 tumors. (A) αCSF-1R treatment indicates up-regulation of genes belonging to activation signatures. Single-cell suspension of whole tumors was obtained 16 h after in vivo treatment with either mIgG1 or αCSF-1R (30 mg/kg; n = 4 each; tumors were treated on day 10 and 11, respectively, after inoculation at a mean tumor volume of ∼200 mm3), and RNA sequencing was performed. Data were compared with activation signatures (Table S1), and genes regulated by αCSF-1R compared with control belong to at least one of the general activation signatures (genes marked in orange are associated with general activation, and genes marked in blue are associated with suppression). (B) MC38 tumor–bearing mice were treated using 30 mg/kg mIgG1, 30 mg/kg αCSF-1R weekly, 4 mg/kg αCD40 once, or a combination of both targeting antibodies, starting treatment at either 80 mm3 or 200 mm3 tumor volume. (C) MC38 tumor–bearing mice were either treated with 30 mg/kg mIgG1 (n = 10) or four times with 4 mg/kg of an anti-CD8α antibody (n = 9) to deplete CD8+ T cells. Isotype control treatment started on day 10, and the anti-CD8α treatment was given on days 7, 9, and 11. Graphs show mean ± SEM of tumor volumes and statistical analyses by two-tailed Student’s t test for each time point depicted. (D) MC38 tumor–bearing mice were treated using 30 mg/kg mIgG1 or 10 mg/kg αPD-1 (three times a week for 2 wk), starting treatment at either 120 mm3 or 225 mm3 tumor volume. (E) MC38 tumor–bearing mice were treated using 30 mg/kg mIgG1, 4 mg/kg αCTLA-4 weekly, 10 mg/kg αPD-1 once, or a combination of both targeting antibodies as well as 4 mg/kg αCD40 once plus 30 mg/kg αCSF-1R weekly, starting treatment at 285 mm3 tumor volume. (F) C57BL/6 mice were inoculated with the indicated syngeneic tumors E0771 and T241 (n = 10 per group and model) and were treated using mIgG1, αCSF-1R, αCD40, or a combination of both targeting antibodies. (B and D–F) Animals were graphically censored in Kaplan-Meier curves once the tumor volume reached ≥700 mm3, and the numbers in graphs indicate the amount of tumor-free mice within the specific group (n = 10 for all groups depicted). Asterisks indicate log-rank tests between αCD40- and αCSF-1R+αCD40–treated animals, and detailed log-rank test results for the other groups are available in Table S2; all animal survival experiments (B–F) were performed at least twice. *, P < 0.05; **, P < 0.01.

