Figure 3.
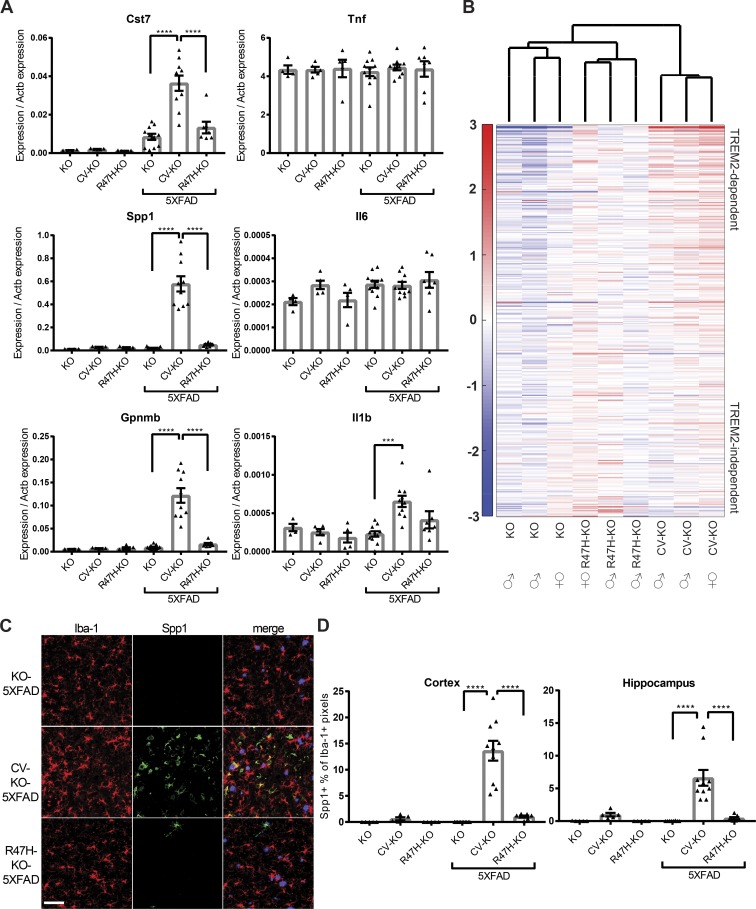
CV-KO-5XFAD mice have increased microglia activation compared with R47H-KO-5XFAD and KO-5XFAD mice. (A) RT-qPCR on whole cortical tissue for neurodegeneration-associated microglial activation markers Cst7, Spp1, and Gpnmb, as well as classical inflammatory cytokines Tnf, Il6, and Il1b, showing dramatically higher microglial activation markers but not inflammatory cytokine transcripts in CV-KO-5XFAD compared with other groups. (B) Microarray analysis of activation markers in sorted microglia shows that KO-5XFAD and R47H-KO-5XFAD cluster together and separately from CV-KO-5XFAD. Gene names and values are given in Table S1. Some variability within CV-KO-5XFAD, R47H-KO-5XFAD, and KO-5XFAD groups was also observed, with females in all groups having higher activation markers. Color scale represents log2 deviation from the row mean. (C) Spp1 protein is detected by confocal microscopy in CV-KO-5XFAD brains and largely absent from R47H-KO-5XFAD and KO-5XFAD brains. Bar, 50 µm. (D) The percent of Iba-1+ (microglia) pixels that were also Spp1+ was quantified in cortex and hippocampus for all 5XFAD and non-5XFAD groups. ***, P < 0.001; ****, P < 0.0001 by one-way ANOVA with Holm-Sidak multiple comparisons testing. Data are presented as mean ± SEM.

