Figure 7.
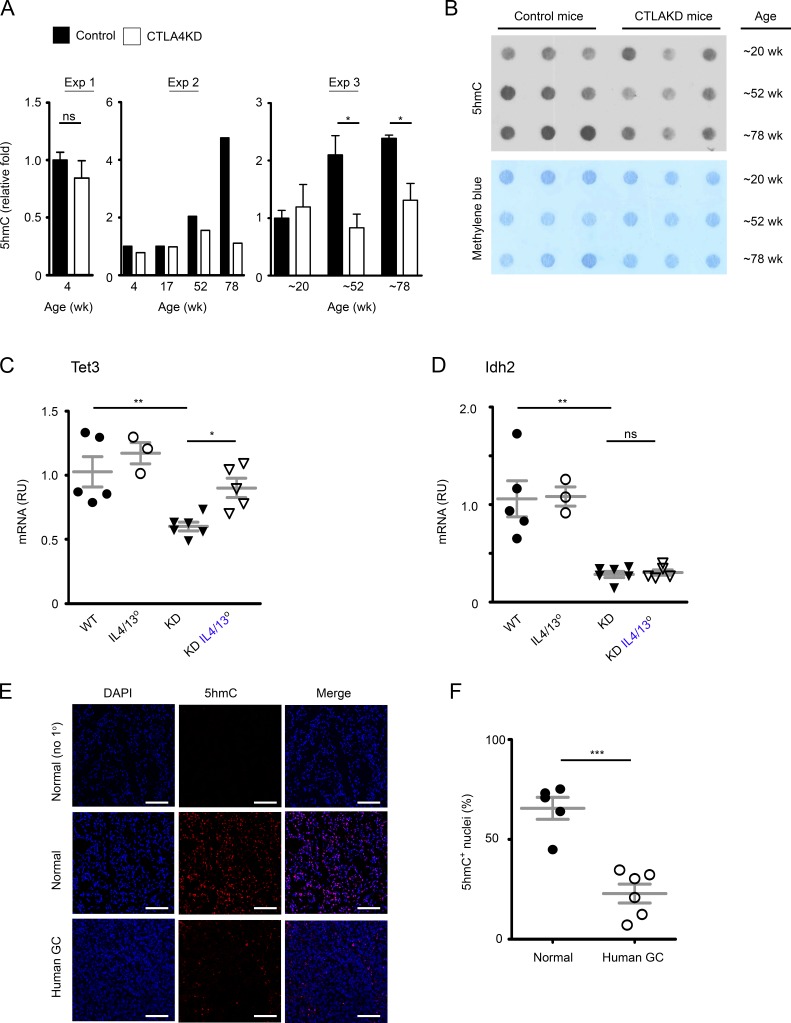
Inflammatory carcinogenesis in the stomach of mice with CTLA4 insufficiency was associated with epigenetic dysregulation in the 5hmC pathway. (A) Relative quantification of 5hmC content in DNA from stomach mucosal tissue of CTLA4KD mice and littermate controls (experiment 1, n = 2–3 mice in each group; experiment 2, each bar represents one animal; experiment 3, n = 3 mice in each group, mean ± SEM). (B) Representative dot-blot of 5hmC staining of genomic DNA (top) compared with methylene blue staining of DNA (loading control). (C and D) mRNA expression of epigenetic regulatory genes Tet3 and Idh2 in gastric mucosal tissue samples of 8- to 10-wk-old CTLA4KD IL4/IL13° mice in comparison to wild-type, IL4/IL13° and CTLA4KD(IL-4/IL-13+) controls. RU, relative units. Data represent three to six mice per group pooled from two experiments. Each data point represents one animal (mean ± SEM; ANOVA). (E and F) 5hmC staining in human GC (adenocarcinoma). Cryosections of frozen GC samples and controls were stained for 5hmC (Red). Results are representative of five normal mucosal samples and six GC samples. Representative staining is shown in C (top panels, no 1° Ab staining control of normal tissues; middle and bottom panels, 5hmc staining of healthy and tumor tissue sections, respectively). DAPI counterstained cell nuclei (blue). Bars, 100 µm. Percentages of 5hmC+ nuclei in the normal versus GC group, with a total of 7,230 and 7,434 nuclei randomly sampled, respectively (n = 5–6 tissue samples; mean ± SEM; Student’s t test), are summarized in D. Data represent two experiments. Each data point represents one sample. *, P < 0.05; **, P < 0.01; ***, P < 0.001.

