Figure 3.
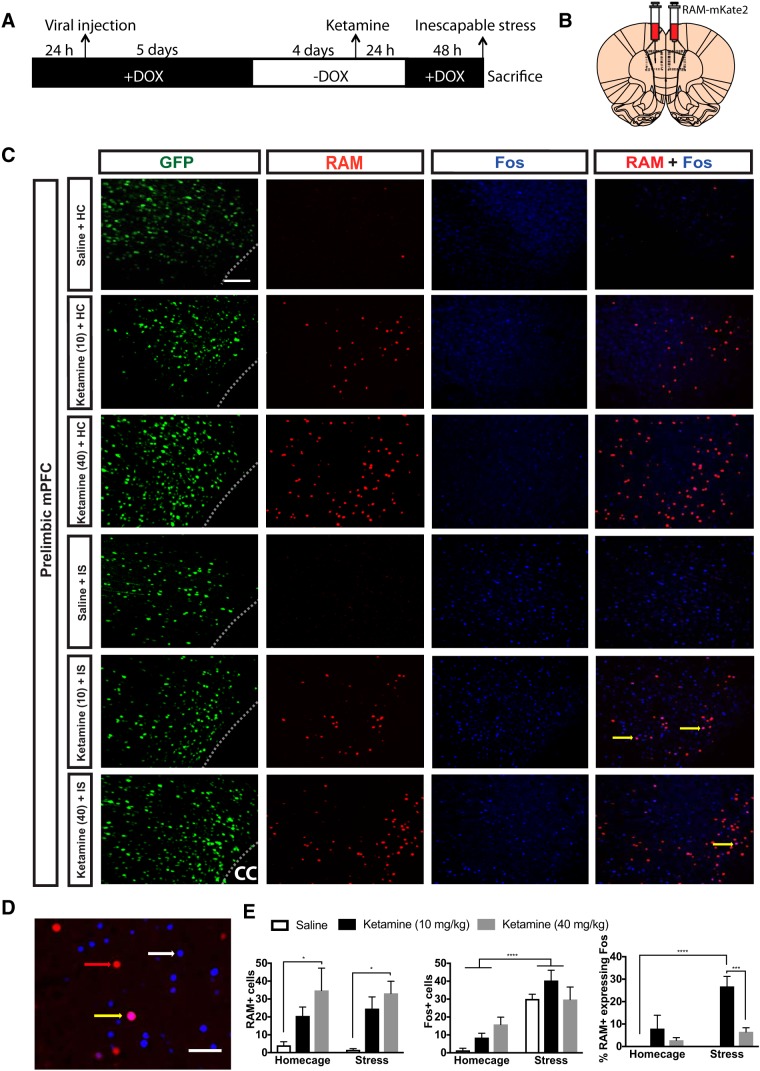
Ketamine-induced RAM labeling of a transcriptionally active neural ensemble that is later activated by uncontrollable stress. A, Schematic timeline of the experimental procedure. Rats were injected with AAV-NLS-RAM-mKate2 (RAM). Nine days later, rats received a single systemic injection of low-dose ketamine (10 mg/kg, i.p.), high-dose ketamine (40 mg/kg, i.p.), or saline. Seventy-two hours later, rats were subjected to IS or left undisturbed in their homecage. B, Schematic diagram of a coronal section of rat brain demonstrating the location of RAM injections into the PL. Viral injection verification was confirmed with eYFP and RAM + Fos were quantified in the PL subregion denoted with a dashed rectangle. C, Representative images of the PL showing eYFP+ cells (green), RAM+ cells (red), Fos+ cells (blue), and RAM cells expressing Fos (denoted with yellow arrows in far right panel). Scale bar: 100 μm and applies to all images. D, Enlarged image of the PL showing RAM (denoted with red arrow), Fos (denoted with white arrow), and a RAM cell expressing Fos (denoted with yellow arrow). Scale bar: 50 μm. E, Number of RAM labeled cells (left), Fos+ cells (middle), and percentage of double-labeled RAM+ cells that also express Fos (right) in the PL of rats that received ketamine or saline followed by later IS or HC treatment. Tukey’s post hoc method: *p < 0.05, **p < 0.01, ***p < 0.001 for graph of RAM+ cells and % RAM cells expressing Fos. Two-way ANOVA main effect: ***p < 0.001 for graph of Fos+. Bars represent group mean ± SEM.

