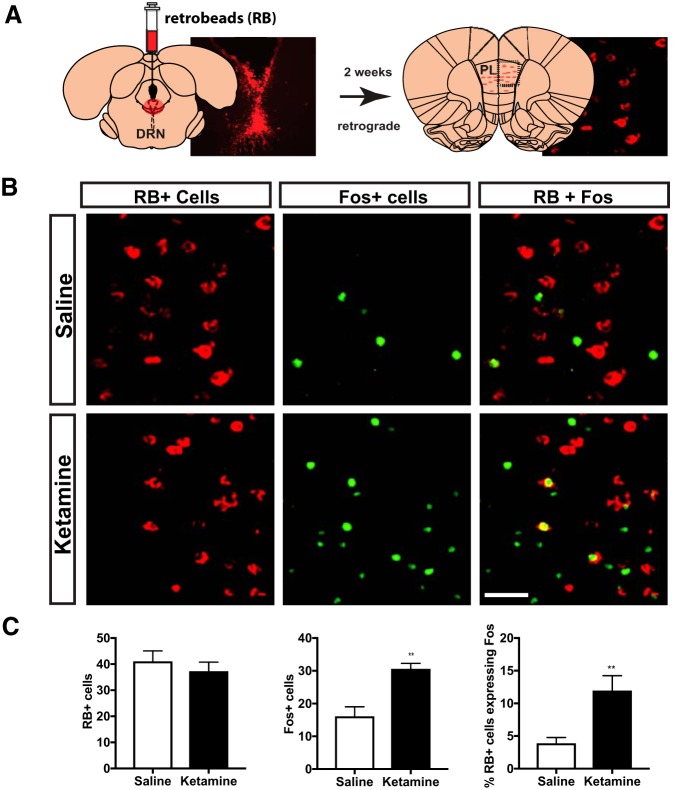
Figure 4.
Acute ketamine activates the PL-DRN pathway. A, Schematic diagram of the experimental procedure. Rats were injected with red fluorescent RBs in the DRN. Two weeks later, rats received a single systemic injection of ketamine (10 mg/kg, i.p.) or saline. Two hours later, rats were killed. RB and Fos expression was assessed in the PL. B, Representative images of the PL showing RB+ cells (red), Fos+ cells (green), and RB + Fos (denoted with white arrows in far right panel). Scale bar: 50 μm and applies to all images. C, Number of RB labeled cells (left), Fos+ cells (middle), and percentage of double-labeled RB-labeled cells that also express Fos (right) in the PL of rats that received ketamine or saline. Unpaired t test: **p < 0.01. Bars represent group mean ± SEM.

