Figure 7.
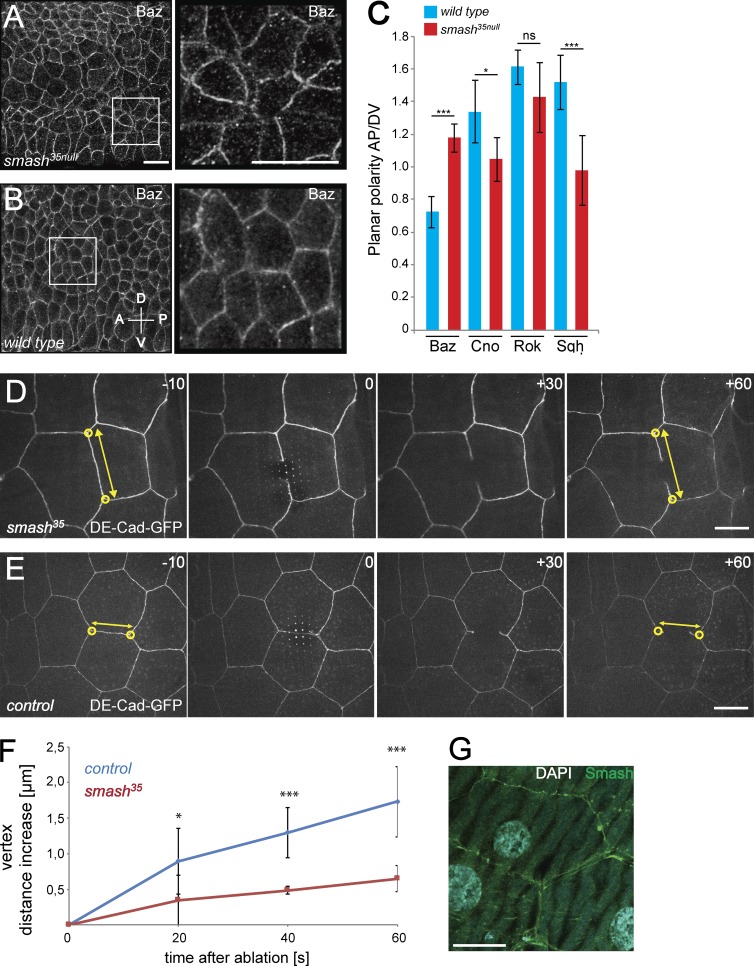
PCP is altered and cell bond tension is reduced upon loss of smash function. (A and B) Smash35null embryos (A) and WT embryos (B) at stage 8 stained for Baz. Right: Higher-magnification views of the boxed areas in corresponding left panels. (C) Quantification of planar polarization of Baz, Cno, Rok, and Sqh in stage 8 embryos. ***, P < 0,001; *, P < 0.05; ns, not significant. For Baz, n = 160 cell contacts analyzed per genotype; for all other proteins, n = 200 cell contacts analyzed per genotype. (D and E) Live imaging of laser ablation of single cell bonds in the epidermis of smash35null (D) and control (E) third instar larvae. The ZA was marked with DE-cad-GFP. The time (seconds) relative to the time point of laser ablation (0) is given in each panel. The distance (double-headed yellow arrows) between vertices (yellow circles) of the ablated cell bond was measured over time. (F) Quantification of vertex distance increase over time in WT and smash35null larvae. Mean vertex displacement amplitude ± SEM: WT (20 s) 0.896 ± 0.462 µm, smash35 (20 s) 0.346 ± 0.353 µm; *, P = 0.0279; WT (40 s) 1.297 ± 0.352 µm, smash35 (40 s) 0.485 ± 0.055 µm; ***, P = 5.998 × 10⁻⁵; WT (60 s) 1.729 ± 0.490 µm, smash35 (60 s) 0.649 ± 0.182 µm; ***, P = 0.00014; mean vertex displacement speed ± SEM in first 60 s: WT 0.029 ± 0.007 µm/s, smash35 0.011 ± 0.003 µm/s; ***, P = 0.00014. P-values were determined using the two-sided unpaired t test. n = 7 representative videos were analyzed for each genotype. (G) Smash (green) localizes to the ZA of third instar larval epidermal cells. DNA was stained with DAPI (cyan). The image is a maximum-intensity projection of three adjacent optical sections at the level of the ZA taken with the Airyscan detector. Bars: (A and B) 10 µm; (D, E, and G) 20 µm. In A and B, anterior is to the left and dorsal is up. Error bars in C and F show mean ± SEM. See also Video 5.

