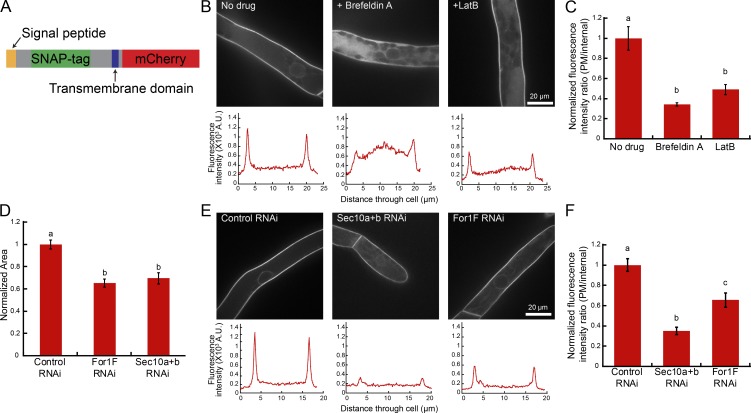
Figure 3.
Exocytosis assay demonstrates that For1F, Sec10b, and actin contribute to secretion. (A) Schematic of SNAP-TM-mCherry, the chimeric transmembrane protein used in the secretion assay. See also Fig. S2. (B) Representative images of cells in a 7-d-old SNAP-TM-mCherry plant regenerated from protoplasts with indicated treatments. Below the images are representative line traces of the fluorescence intensity from a cell transect. (C) Quantification of the ratio of plasma membrane (PM) to internal fluorescence intensity. Error bars represent SEM (control, 7; BFA, 7; LatB, 6), and letters above the bars indicate statistical groups with α < 0.05 from an ANOVA analysis. (D) Quantification of the area of 7-d-old plants expressing the indicated RNAi constructs. All data are normalized to the control. Error bars represent SEM (n = 30 plants for each condition), and letters above the bars indicate statistical groups with α < 0.05 from an ANOVA analysis. See also Fig. S1. (E) Representative images of cells from 7-d-old SNAP-TM-mCherry plants silenced with indicated RNAi constructs. Below the images are representative line traces of the fluorescence intensity from a cell transect. (F) Quantification of the ratio of plasma membrane to internal fluorescence intensity. Error bars represent SEM (control RNAi, 6; Sec10a+b-RNAi, 4; For1F-RNAi, 8), and letters above the bars indicate statistical groups with α < 0.05 from an ANOVA analysis.

