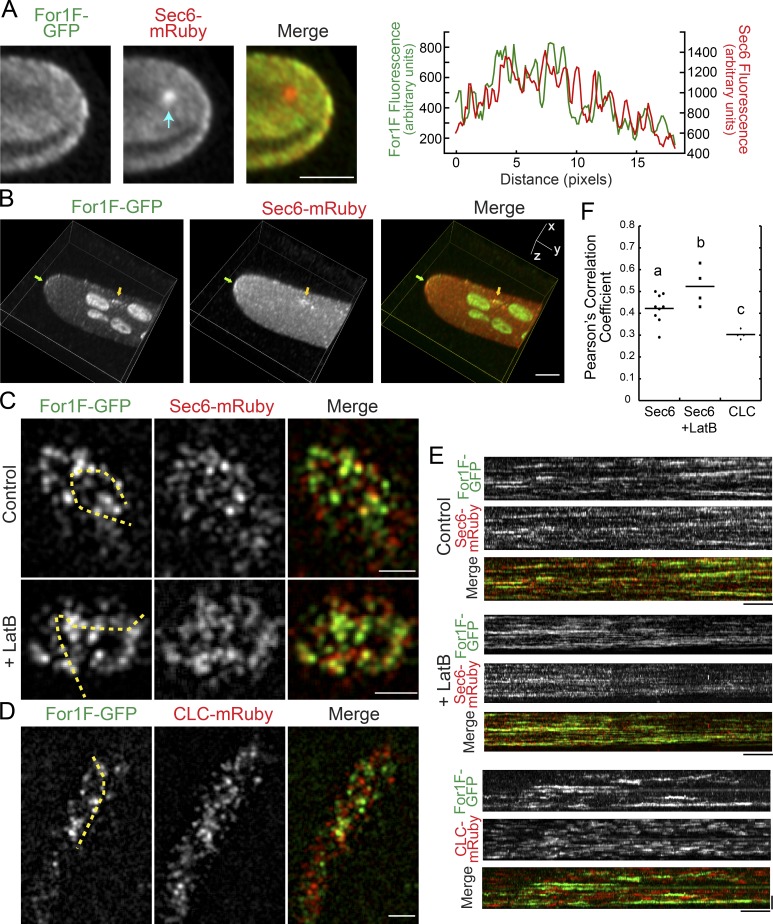
Figure 4.
For1F-GFP dynamically associates with Sec6-mRuby. (A) Laser scanning confocal image of a single focal plane at the apex of a protonemal cell expressing endogenously tagged For1F-GFP and Sec6-mRuby. See also Fig. S2. Arrow indicates intracellular Sec6-mRuby accumulation. Bar, 5 µm. Graph shows the fluorescence intensity from a line trace at the plasma membrane of the cell. (B) Volume view of a z-stack acquired on a laser scanning confocal microscope. Images were deconvolved with NIS-elements (five iterations, type Richardson-Lucy.) For1F-GFP (green) and Sec6-mRuby (red) concentrate at the cell tip (green arrow) and on other regions of the plasma membrane (yellow arrow). Bar, 5 µm. (C) VAEM images of the cortex of cells expressing endogenously tagged For1F-GFP and Sec6-mRuby in the presence (control) or absence (LatB) of actin filaments. Bar, 2 µm. Also see Videos 1 and 4. (D) VAEM images of the cortex of cells expressing For1F-GFP and CLC-mRuby. Bar, 2 µm. Also see Video 6. (E) Kymographs generated from the yellow dashed lines shown in C and D. Bars: (horizontal) 1 min; (vertical) 2 µm. (F) PCCs from kymographs generated by drawing a line through the brightest Sec6-mRuby or CLC-mRuby particles present in the first frame of a 10-min time-lapse acquisition (see Fig. S4). Letters indicate statistical groups with α < 0.05 from a Fisher’s least significant difference ANOVA test.

