Figure 6.
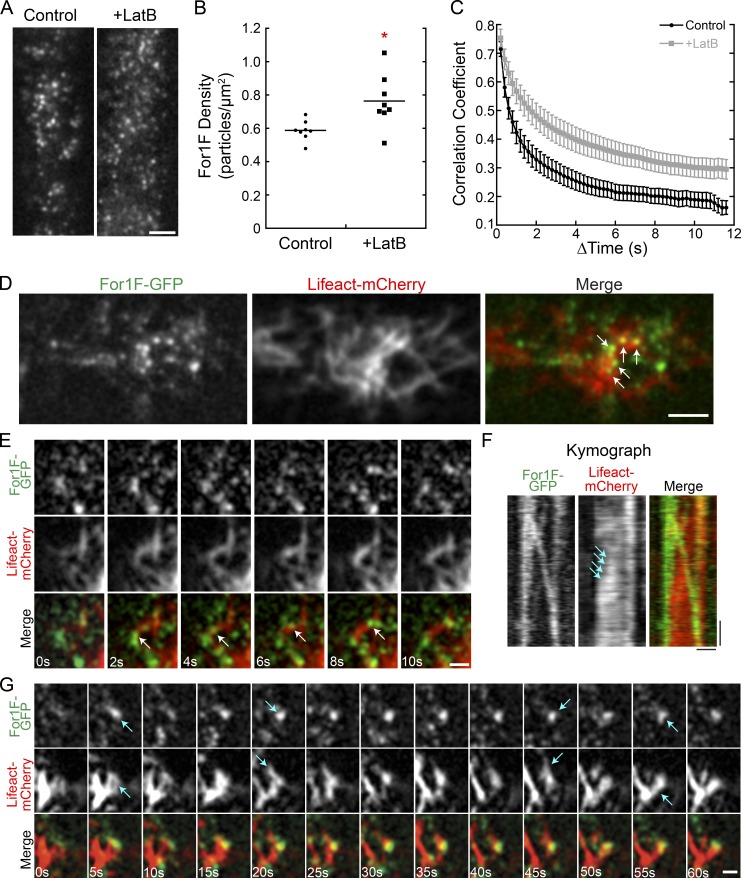
Cortical For1F-GFP dynamics are dampened in the absence of actin, and cortical For1F-GFP associates with areas of active actin remodeling. (A) VAEM images of the cell cortex in a line expressing endogenously tagged For1F-GFP show that in the absence of actin, more For1F remains at the cell cortex. Bar, 2 µm. Also see Video 7. (B) Quantification of For1F-GFP density in the presence and absence of actin filaments. The mean density from 150 frames of a time-lapse acquisition was measured for eight cells for each condition. The asterisk indicates statistical significance with α < 0.05 from an ANOVA analysis. (C) Quantification of cortical For1F-GFP dynamics in the presence or absence of actin filaments. The correlation coefficient between two images was calculated at all possible temporal spacings (time interval). Error bars represent SEM (n = 10 cells). (D) Representative VAEM image from a time-lapse acquisition of the cortex of a cell expressing Lifeact-mCherry and endogenously tagged For1F-GFP. Arrows indicate For1F-GFP at actin filament junctions. Bar, 5 µm. (E) Example where For1F-GFP travels linearly along an existing actin filament (arrows). Bar, 1 µm. Also see Video 8. (F) Kymograph of For1F-GFP linear trajectory from E. Arrows indicate increase in Lifeact-mCherry signal as the particle traverses along a preexisting actin filament. Bars: (horizontal) 1 µm; (vertical) 2 s. (G) Example of a relatively stationary For1F-GFP associated with polymerizing and depolymerizing actin filaments, indicated by arrows. Bar, 1 µm. Also see Video 9.

