Figure 7.
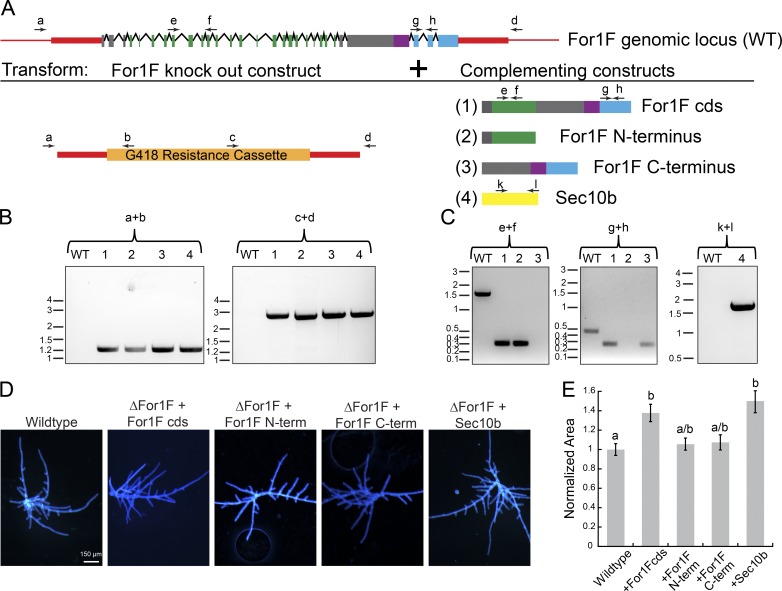
Fusion of the Sec10 and formin domains is not essential for For1F function in protonemal growth. (A) Schematic representation of the For1F genomic locus and the complementation experiments in which the For1F knockout construct was simultaneously transformed with one of the four indicated expression constructs. Red regions indicate genomic noncoding sequence of the For1F locus, and red boxes were sequences incorporated into the knockout construct. For both the For1F gene model and the expressed constructs, green represents sequences with similarity to Sec10; purple, FH1; blue, FH2; and gray boxes, no known sequence similarity. Arrows labeled with letters above the gene model and expression constructs are primers used to perform genotyping. (B) Genotyping for proper integration of the knockout construct into the For1F genomic locus at both 5′ (primers a + b) and 3′ (primers c + d) ends. Wild type (WT) does not produce a PCR product because the wild-type locus cannot anneal to primers b and c, which are specific to the antibiotic resistance cassette. Size in kb is indicated to the left of each gel. (C) Genotyping for the presence of the expression construct. Primers e + f amplify a 0.305-kb region of the coding sequence (cds) of For1F in the Sec10 region. The equivalent genomic region is 1.506 kb. Primers g + h amplify a 0.288-kb region of the For1F cds in the formin region. The equivalent genomic region is 0.471 kb. As expected, wild type only amplifies the genomic fragment in each case, whereas lines that contain the rescue constructs lack the genomic fragment and only amplify the cds fragment. Primers k + l amplify a 1.567-kb region of the Sec10b cds. No amplification for the genomic amplicon is observed in wild type or the Sec10b rescued line because the genomic amplicon is 5.116 kb and did not amplify with the short extension time used to amplify the cds amplicon. Size in kb is indicated to the left of each gel. (D) Images of 7-d-old plants regenerated from protoplasts. Plants were stained with calcofluor. Bar, 150 µm. (E) Plant area was quantified by measuring the area of calcofluor fluorescence. All data are normalized to the wild-type control. Error bars represent SEM (wild type, n = 169; ΔFor1F+For1Fcds, n = 50; ΔFor1F+For1FNterm, n = 48; ΔFor1F+For1FCterm, n = 50; ΔFor1F+Sec10b, n = 50), and letters above the bars indicate statistical groups with α < 0.05 from ANOVA.

