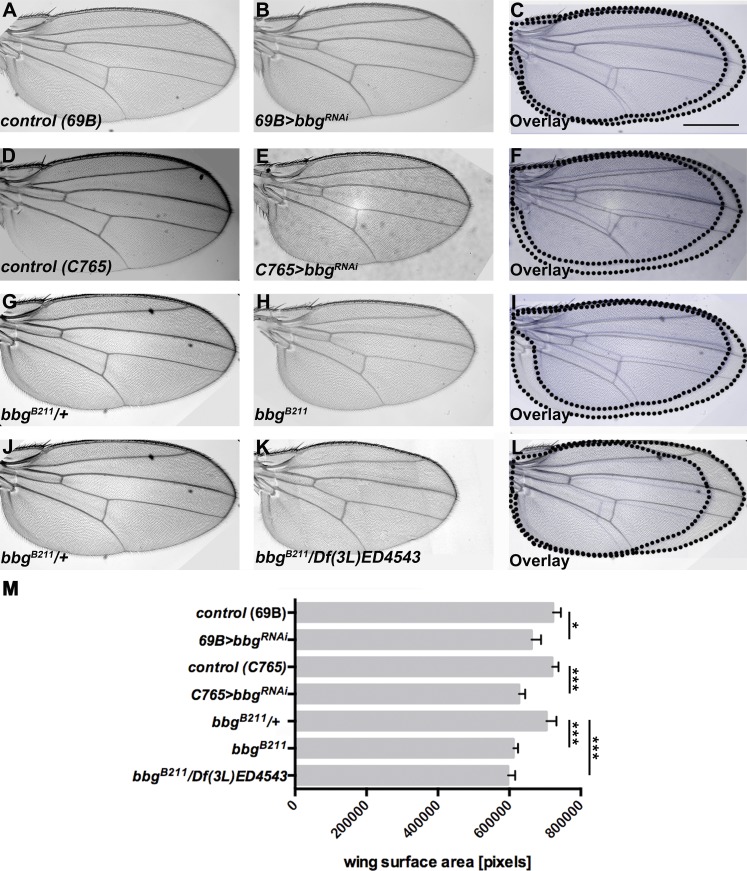
Figure 1.
Loss of bbg results in smaller wings. (A–C) Control (69B-Gal4) wing (A), wing expressing UAS-bbgRNAi with 69B-Gal4 (B), and overlay (C). (D–F) Control (C765-Gal4) wing (D), wing expressing UAS-bbgRNAi with C765-Gal4 (E), and overlay (F). (G–I) bbgB211/+ heterozygous wing (G), bbgB211 mutant wing (H), and overlay (I). (J–L) bbgB211/+ heterozygous wing (J), bbgB211/Df(3L)ED4543 wing (K), and overlay (L). (M) Wing size measurement of the surface area of 50 (A–C and G–I) and 15 (D–F and J–L) independent females per genotype. The statistical analysis (M) used t test and ANOVA. *, P ≤ 0.1; ***, P ≤ 0.001. G and J show the same wing, because all figures depicted here were obtained in the same experiment. Error bars show SD. Bar, 500 µm.

