Figure 2.
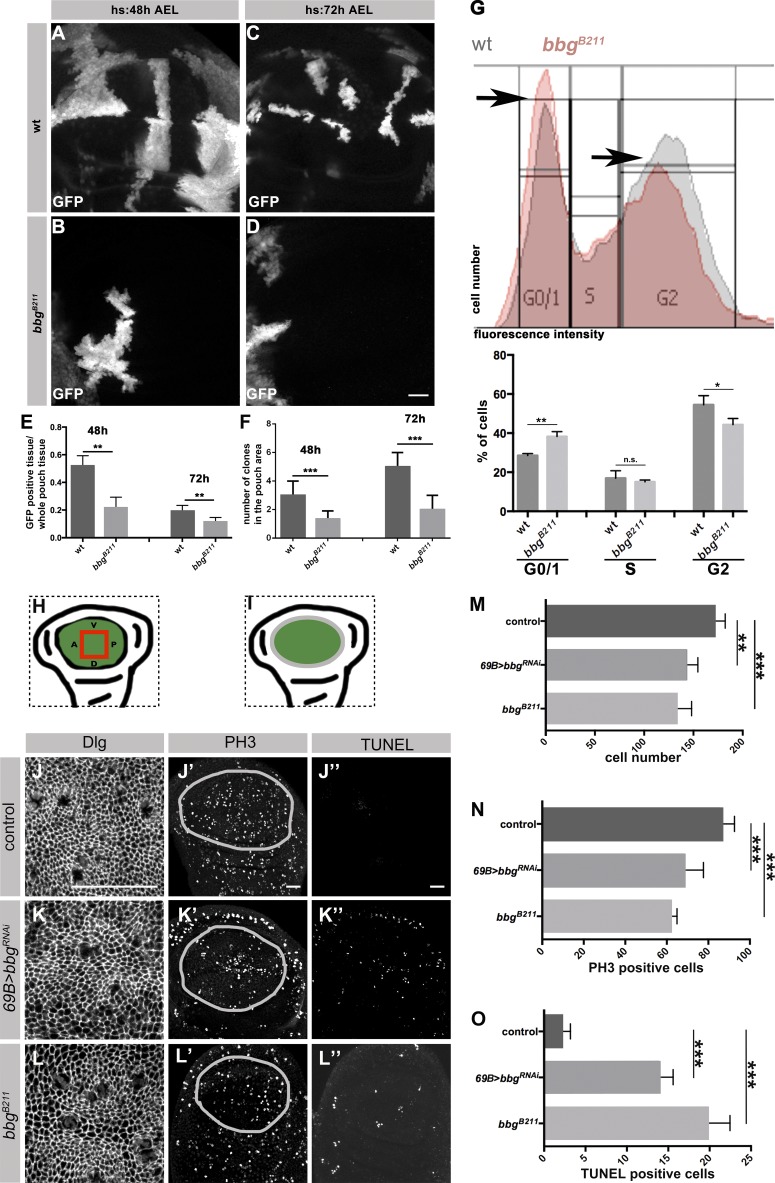
Loss of bbg results in fewer cells and increased apoptosis in L3 wing discs. (A–D) GFP expressing clones in WT (A and C), and bbgB211 mutant L3 wing discs (B and D) induced at different time points (heat-shock [hs] 48 h and 72 h AEL) and stained with an anti-GFP. (E and F) Ratio of GFP-positive clones to the whole pouch (E), and number of GFP-positive clones in the pouch of WT and bbgB211 mutant L3 wing discs (F), induced by 48 and 72 h AEL, using 10 independent discs per genotype. (G) FACS analysis from cells of ∼20 L3 wing discs (10,000 events/cells per condition) of WT and bbgB211 mutant. Histograms display DNA content/fluorescent intensity (x-axis) and cell numbers (y-axis). Diagram: Mean of WT and bbgB211 mutant cells in every cell cycle stage (three biological replicates per condition). (H and I) Cartoons representing the wing pouch (green), the area measured in J, K, and L (red box, H) and the outline of the pouch measured in J′, J′′, K′, K′′, L′, and L′′ (gray outline, I). Control (69B-Gal4; J–J′′), 69B>bbgRNAi (K–K′′), and bbgB211 mutant (L–L′′) L3 wing discs stained with anti-Dlg, anti-PH3, and TUNEL, respectively. Measurement of cell numbers (M), PH3-positive cells (N), and TUNEL-positive cells (O) in all three genotypes, respectively, using eight independent L3 wing discs per genotype. The statistical analysis (E–G and M–O) used t test and ANOVA. *, P ≤ 0.1; **, P ≤ 0.01; ***, P ≤ 0.001. Error bars show SD. Bars, 25 µm.

