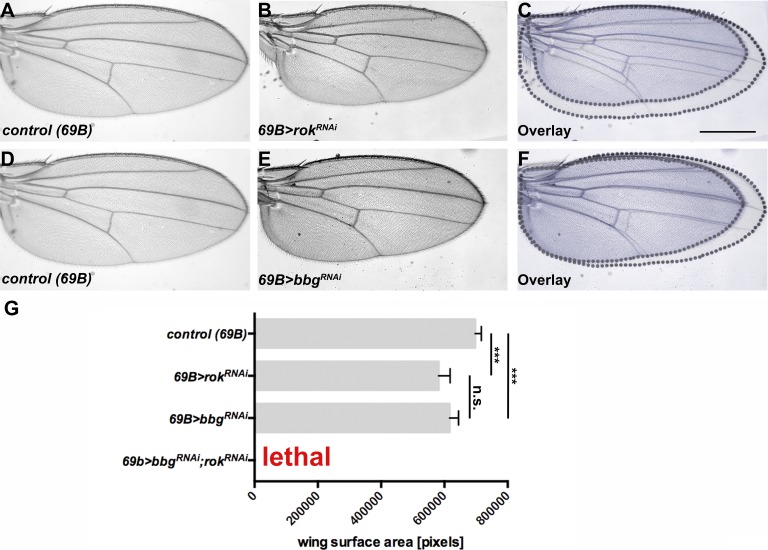
Figure 5.
bbgand rok genetically interact. (A–C) Control (69B-Gal4) wing (A), wing expressing UAS-rokRNAi with 69B-Gal4 (B), and overlay (C). (D–F) Control (69B-Gal4) wing (D), wing expressing UAS-bbgRNAi with 69B-Gal4 (E), and overlay (F). (G) Wing size measurement of the surface area of 15 independent females per genotype. The statistical analysis (G) used t test and ANOVA. ***, P ≤ 0.001. A and D show the same control wing, because all figures depicted were obtained in the same experiment. Error bars show SD. Bar, 500 µm.

