Figure 7.
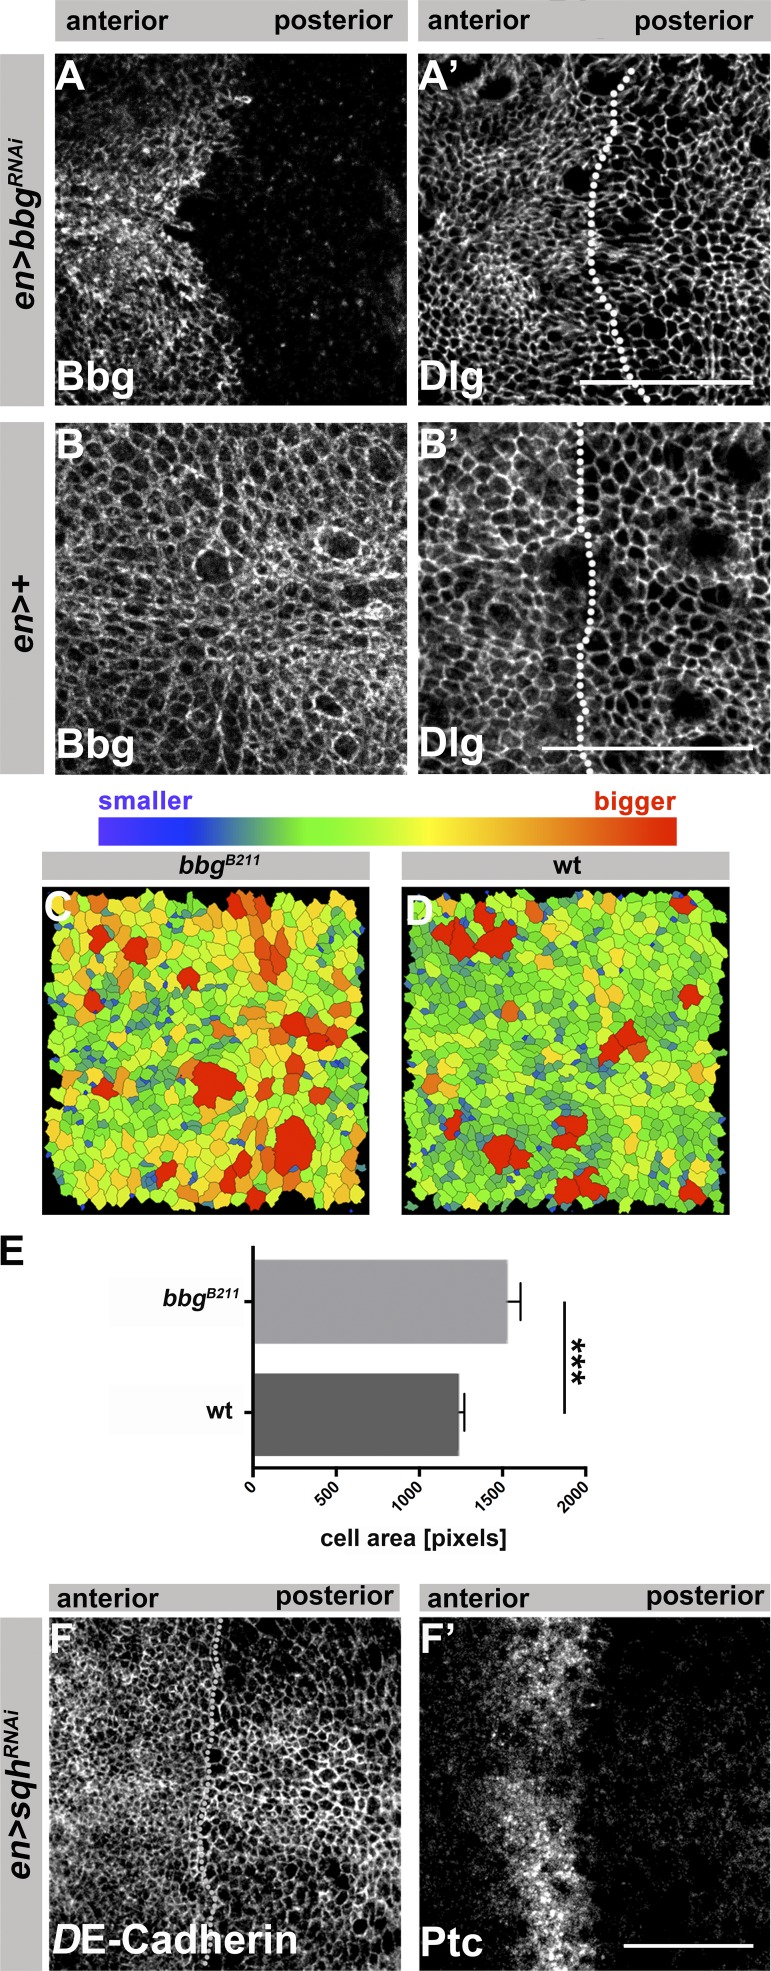
Loss of bbg or sqh results in cells with larger surface areas. en>bbgRNAi (A and A′) and control (en-Gal4; B and B′) L3 wing discs, stained with anti-Bbg and anti-Dlg, respectively. The dotted lines in A′ and B′ highlight the AP boundary. Images of bbgB211 mutant (C) and WT (D) L3 wing discs tracked using the “Tissue Analyzer” plug-in from Fiji to quantify the surface area of the cells. Cell outlines were tracked from anti–DE-cadherin staining from fixed tissues. (E) Measurement of the mean pixel area of each cell per image (three independent samples were quantified per genotype). (F and F′) Wing pouch of L3 discs expressing UAS-sqhRNAi with en-Gal4, stained with anti–DE-cadherin (F) and anti-Patched (Ptc; F′). The dotted line in H highlights the AP boundary. The statistical analysis (F) used t test and ANOVA. ***, P ≤ 0.001. Error bar shows SD. Bars: (A–B′ and F and F′) 25 µm.

