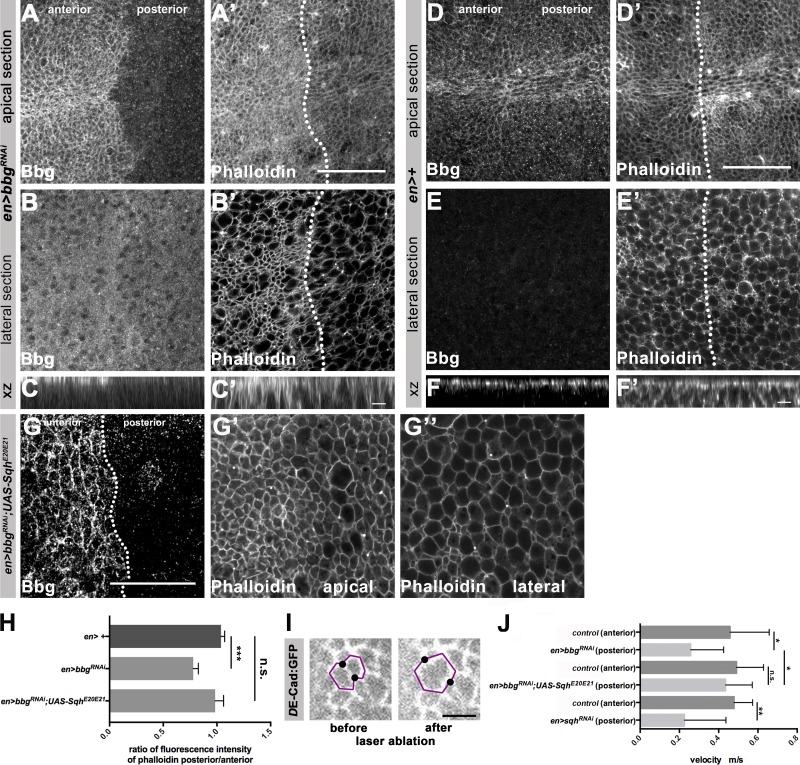
Figure 8.
Bbg and Sqh cooperate to control the apical actomyosin and junctional tension. (A–B′) en-Gal4; UAS-bbgRNAi L3 wing disc stained with anti-Bbg and Phalloidin-488 (F-actin), apical (A and A′) and lateral (B and B′) sections. (C and C′) xz projection of the central area of the respective L3 wing disc shown in A–B′. (D–E′) Control (en-Gal4) L3 wing disc stained with anti-Bbg and Phalloidin-488, apical (D and D′) and lateral (E and E′) sections. (F and F′) xz projection of the central area of the respective L3 wing disc shown in D–E′. (G) en-Gal4, UAS-bbgRNAi;UAS-SqhE20E21 L3 wing disc stained with anti-Bbg and Phalloidin-488 (F-actin), apical (G′) and lateral (G′′) sections. (H) Ratio of posterior/anterior fluorescence intensity of phalloidin of control (en-Gal4), en-Gal4, UAS-bbgRNAi and en-Gal4, bbgRNAi;UAS-SqhE20E21 L3 wing discs (seven independent discs per condition). (I) Cells from DE-cadherin:GFP L3 wing discs before and after laser ablation. The black dots show the cell vertices that were displaced upon laser ablation. (J) Measurement of the velocity of the displaced cell junctions in the anterior en-Gal4 (control) and posterior (en-Gal4, UAS-bbgRNAi, en-Gal4, UAS-bbgRNAi;UAS-SqhE20E21, en-Gal4; UAS-sqhRNAi, respectively) compartments upon laser ablation; n = 14. The statistical analysis (H) used t test and ANOVA. *, P ≤ 0.1; **, P ≤ 0.01; ***, P ≤ 0.001. Error bar shows SD. Bars: (A–B′, D–E′, and G–G′′) 25 µm; (C, C′, F, and F′) 5 µm.

