Figure 2.
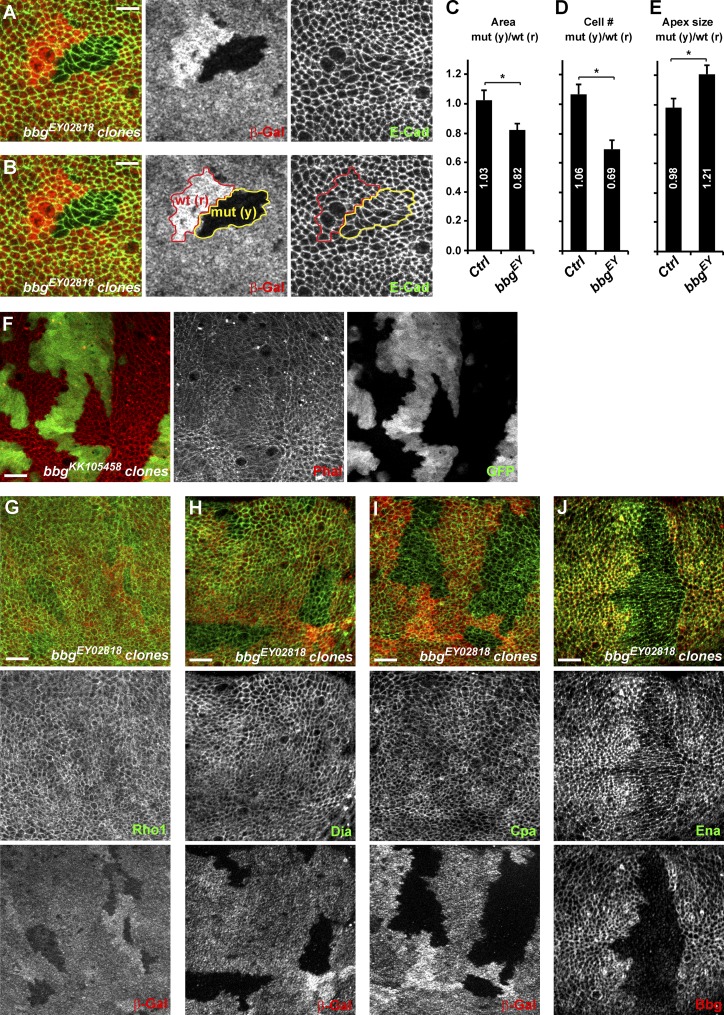
bbg controls cell number and cell size. (A and B) Mitotic clones for bbgEY02818 in the central region of third instar wing imaginal discs. Homozygous mutant clones are marked by the absence of β-galactosidase (β-Gal; red; middle panels) and highlighted by the yellow outline (mut (y)) in the right two panels in B. Twin spots, which were fully WT for bbg and arose at the same time as the bbg mutant clones, are marked by the bright β-Gal staining (two copies), and are highlighted by the red outline (wt (r)) in the middle and right panels in B. Apical cell outlines are revealed by E-Cad staining (green; right). Bars, 5 µm. (C–E) Quantification of the mean FRT80B bbgEY02818 mutant clone total area (C), cell number (D), and apical cell size (E) and shown as the mean ratio between individual mutant tissue clones (yellow) and their corresponding WT twin spots (red). Controls were “empty” clones performed with FRT80B. SEM is shown; unpaired two-tailed student t test; *, P < 0.05; n = 10 clone pairs from independent discs. (F) Overexpression clones marked by GFP (green, right) leading to the depletion of bbg and showing the organization of the cortical apical F-actin (red, middle). A strong decrease of apical F-actin was seen in bbg-depleted cells. (G–J) bbgEY02818 mutant clones in the larval wing disc marked by the absence of β-galactosidase (red, bottom) and marked for the actin regulators Rho1 (G; green, middle), Dia (H; green, middle), Cpa (I; green, middle), and Ena (J; green, middle). Cpa and Ena cortical levels were reduced in bbg mutant cells. Bars, 10 µm.

