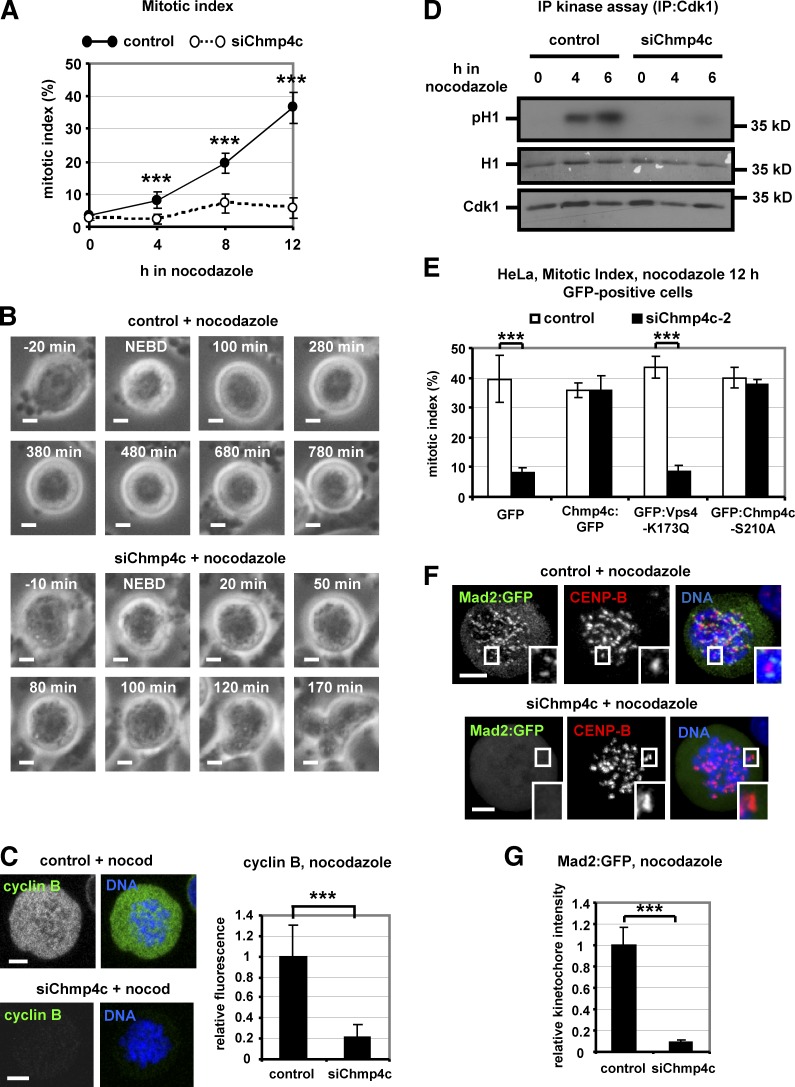
Figure 5.
Chmp4c-deficient cells exit mitosis in nocodazole. (A) Mitotic index analysis in cells transfected with negative siRNA (control) or Chmp4c siRNA (siChmp4c) and treated with nocodazole. n = 300 cells per time point and per treatment, from three independent experiments. (B) Time-lapse analysis of BE cells transfected as in A and treated with nocodazole. Phase-contrast images of a control cell arrested with condensed chromatin (top) or a Chmp4c-deficient cell that exited mitosis, decondensed its chromatin and became multinucleated (bottom). Time is from NEBD. Related to Videos 7 and 8. (C) Cyclin B fluorescence in cells transfected as in A and treated with nocodazole (nocod) for 4 h. Mean cyclin B intensity is shown, and values in the control were set to one. n = 100 cells from three independent experiments. (D) Cdk1-associated histone H1 phosphorylation (pH1; top), ponceau staining of histone H1 (middle), and Western blot analysis of immunoprecipitated (IP) Cdk1 (bottom). (E) Mitotic index analysis. Cells expressing GFP, WT or S210A mutant Chmp4c:GFP resistant to degradation by Chmp4c-2 siRNA (siChmp4c-2), or GFP:Vps4-K173Q were transfected with negative siRNA (control) or siChmp4c-2 and treated with nocodazole for 12 h. n = 300 cells from three independent experiments. (F and G) Localization of Mad2:GFP in cells treated as in C. Relative green/red fluorescence intensity is shown, and values in the control were set to one. n > 200 kinetochores, 20 cells from three independent experiments. Error bars show the SD. ***, P < 0.001 compared with the control. Student’s t test was used. Insets in F show 1.7× magnification of kinetochores. Bars, 5 µm.

