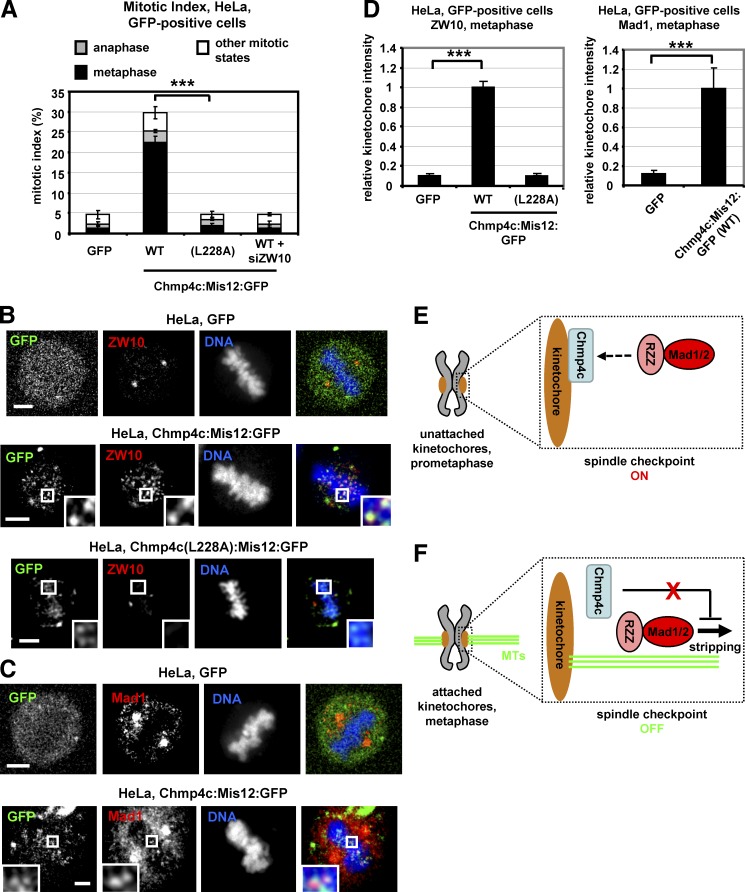
Figure 8.
Expression of Chmp4c:Mis12:GFP induces accumulation of metaphase cells. (A) Cells were transfected with GFP, WT, or mutant (L228A) Chmp4c fused to Mis12:GFP in the absence or presence of ZW10 siRNA (siZW10) and analyzed for mitotic index and phenotypes at 24 h after transfection. GFP, tubulin, and DNA staining were used to determine mitotic index and fraction of cells in metaphase, anaphase, or all other mitotic states. n = 300 cells per condition from three independent experiments. (B–D) Localization of ZW10 or Mad1 at metaphase plate in cells treated as in A. Relative red fluorescence intensity is shown, and values in WT Chmp4c:Mis12:GFP were set to one. n > 100 kinetochores, 10 cells from three independent experiments. Error bars show the SD. ***, P < 0.001 compared with the control. Statistically significant differences were determined by ANOVA and Student’s t test. Insets in B and C show 1.7× magnification of kinetochores. Bars, 5 µm. (E and F) Model for the role of Chmp4c in the spindle checkpoint. MTs, microtubules; dashed arrow, RZZ binding to Chmp4c. See text for details.

