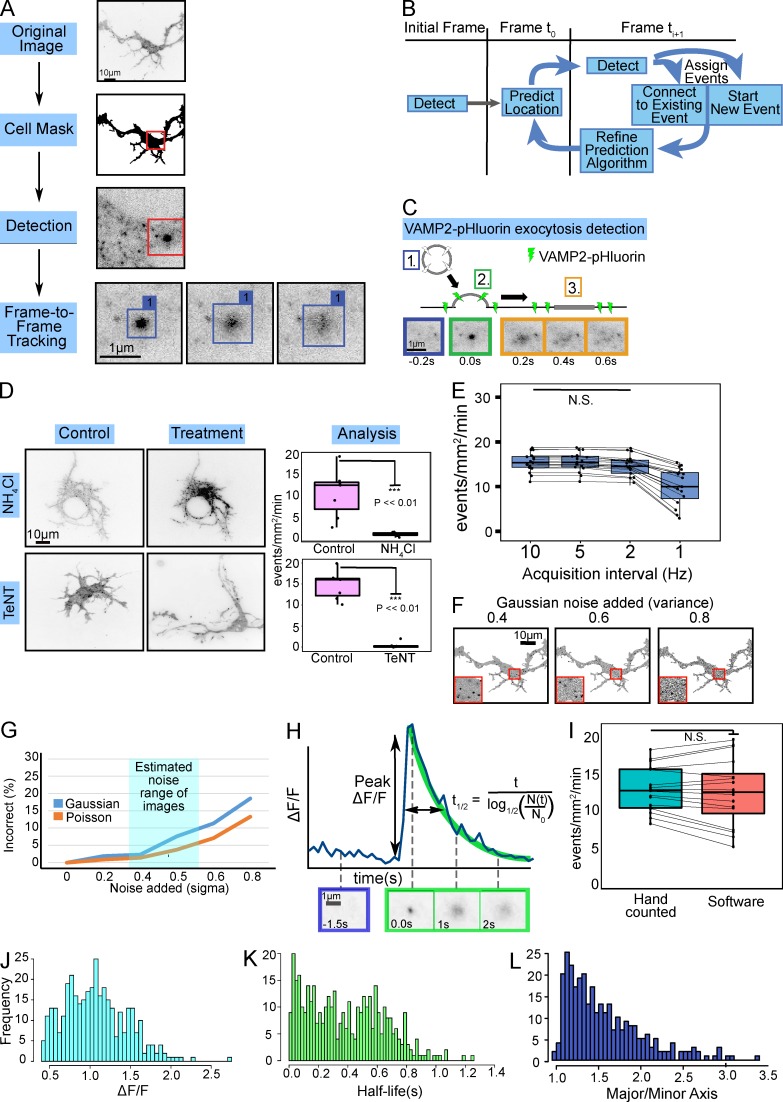
Figure 1.
Automated identification and analysis of VAMP-pHluorin mediated exocytosis. (A) Overview of automated software. A cell mask is generated, followed by fluorescent maxima detection. A tracking matrix connects candidate events over time (Frame-to-Frame Tracking). (B) The tracking matrix was constructed using a Kalman filter to link a single exocytic event into a track over multiple frames. (C) Schematic and TIRF image montage show a typical exocytic event. Prefusion, VAMP2-pHluorin is not fluorescent (1, blue). Upon fusion pore opening (2, green), a bright fluorescent diffraction-limited spot appears. The VAMP2-pHluorin diffuses in the membrane over time (3, orange). (D) Example minimum projections of inverted TIRF time-lapse images before or after treatment with NH4Cl or TeNT. NH4Cl or TeNT treatment reduced the number of events detected (box plot, median ± interquartile range (IQR); whiskers reach minimum and maximum values within 1.5 times the IQR; n = 6 neurons per condition). See Video 2. (E) Box and whisker plots of effect of acquisition rate on exocytic detection (n = 17). (F) Examples of simulated images with noise of increasing Gaussian intensity. (G) Six simulations of exocytic events with increasing Gaussian or Poisson intensity demonstrate the robustness of the algorithm to image background and system noise. Typical experimental signal-to-background is highlighted in cyan. (H) ΔF/F for an individual exocytic event. Fusion pore opening occurs at time = 0 s. The normalized peak change in fluorescence intensity (peak ΔF/F) and event t1/2 (in s) are indicated. Initial fluorescence is estimated from 10 frames (1 s) before peak of fluorescence (initiation of exocytosis). t1/2 is estimated using a negative exponential decay. (I) Box and whisker plots of user-based and automated detection of the frequency of VAMP2-pHluorin–mediated exocytosis were not different (n = 16, paired t test, P = 0.56). Data points represent frequency per cell. Histograms of measured peak ΔF/F (J), event t1/2 (K), and major/minor axis of the first frame of each detected exocytic event (L). n = 462 exocytic events for each.

