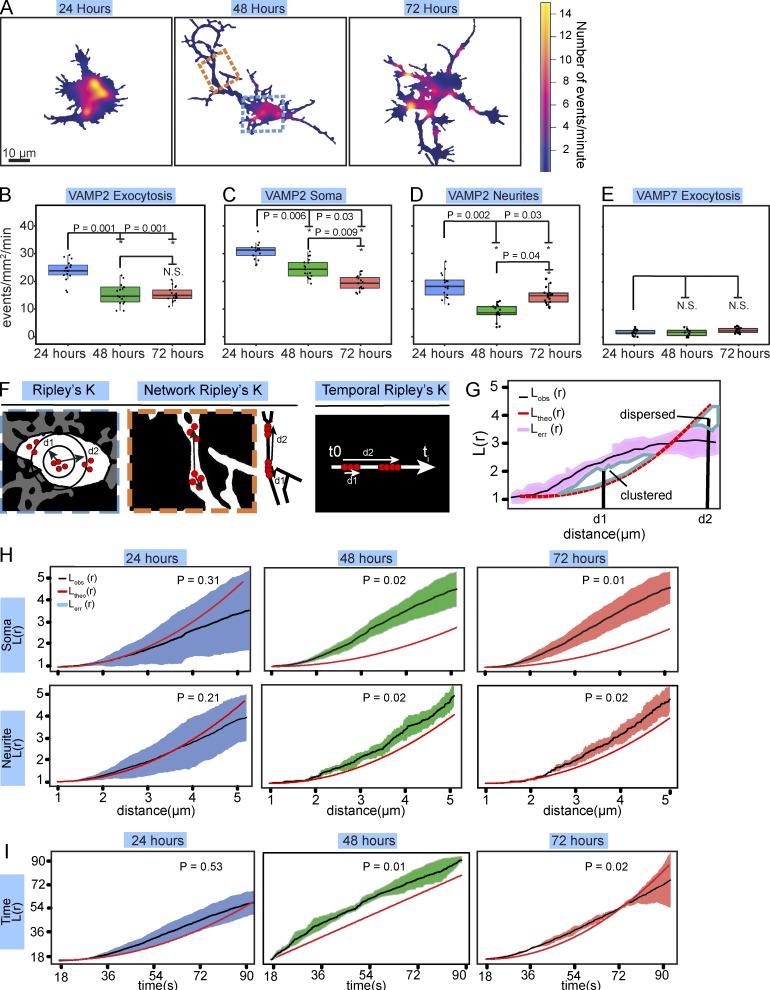
Figure 2.
Spatiotemporal changes in exocytosis during neuronal development. (A) Heat maps of the density of VAMP2-mediated exocytosis in cortical neurons cultured in vitro for 24, 48, or 72 h before imaging. The blue and orange boxes demarcate soma and neurite examples used in F, respectively. (B) Frequency of VAMP2-pHluorin mediated exocytosis for basal plasma membrane of cortical neurons over developmental time. (*, P < 0.05; n = 17 cells per condition and 464, 455, and 466 exocytic events per condition; box and whiskers plots, box shows median ± IQR and whiskers reach minimum and maximum values within 1.5 times the IQR). See Video 3. (C and D) Box and whiskers plots of frequency of VAMP2-pHluorin–mediated exocytosis in the soma (C) and neurites (D) of cortical neurons. (E) Box and whiskers plots of frequency of VAMP7-pHluorin–mediated exocytosis for basal plasma membrane was not significantly different between time points (n = 14 cells per condition). See Video 4. (F) Schematics of Ripley’s L(r) function in spatial and temporal dimensions. Red dots represent exocytic events. (G) Example of Ripley’s L(r) analyses. The mean L(r) value of the aggregated data from multiple replicates (LObs[r], black line) and standard error of the data (Lerr[r], pink) is compared with the expected L(r) value of completely random exocytic events (Ltheo[r], red dashed line). (H) Spatial Ripley’s L(r) function analysis revealed that events were randomly distributed in the soma at 24 h, whereas exocytosis occurred in spatial clusters in the soma at 48 and 72 h. Exocytosis followed a similar pattern in the neurites (LObs[r] = mean of 17 per condition). (I) Temporal Ripley’s L(r) function of exocytic events over time in mouse cortical neurons, yet temporal bursts of exocytosis at 48 and 72 h in vitro (LObs[r] = mean of 17 per condition). See Video 3.

