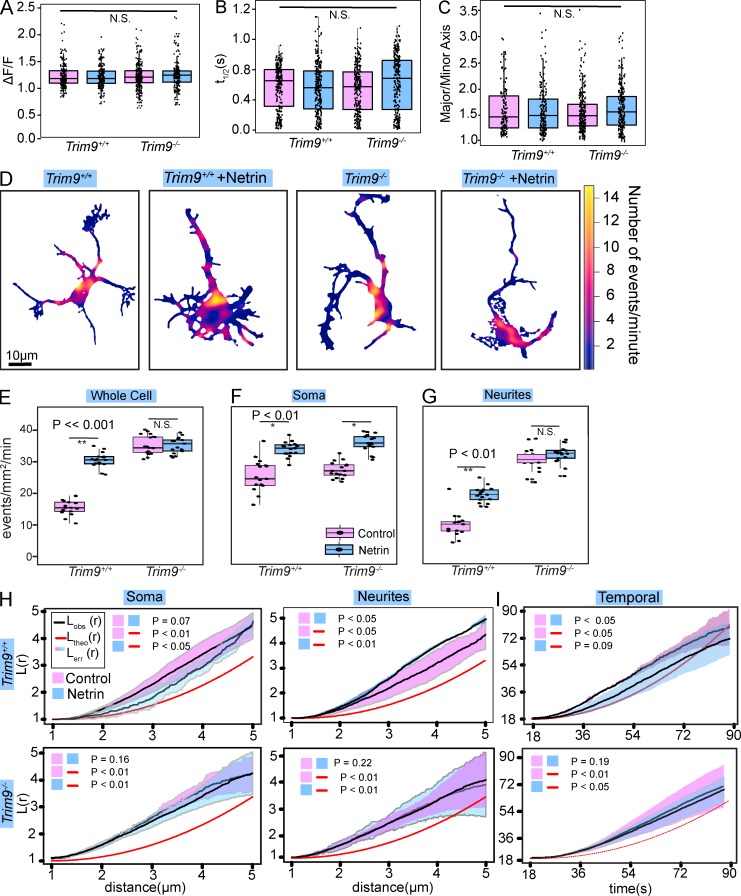
Figure 4.
Netrin and TRIM9-dependent changes in the distribution of exocytosis. (A–C) Individual data points and box and whisker plots of peak ΔF/F (A), t1/2 (B), and major/minor axis (C) of VAMP2-mediated exocytosis in Trim9+/+ and Trim9−/− cortical neurons, treated or untreated with netrin-1 (n = 562, 632, 643, and 673 exocytic events per condition, respectively; box represents median ± IQR, whiskers reach minimum and maximum values within 1.5 times the IQR). (D) Heat maps of density of exocytosis. (E) Individual data points and box and whisker plots of frequency of VAMP2-pHluorin–mediated exocytosis (n = 17 cells per condition). (F and G) Frequency of VAMP2-pHluorin–mediated exocytic events in the soma (F) and neurites (G). (H) Ripley’s L(r) function applied to the soma and neurites. The data line and pink surrounding SEM represent untreated, and the data line and surrounding blue SEM represent netrin-1–treated neurons (n = 17 cells per condition). (I) 1D Ripley’s L(r) function of exocytic events over time (n = 17 cells per condition).

