Figure 4.
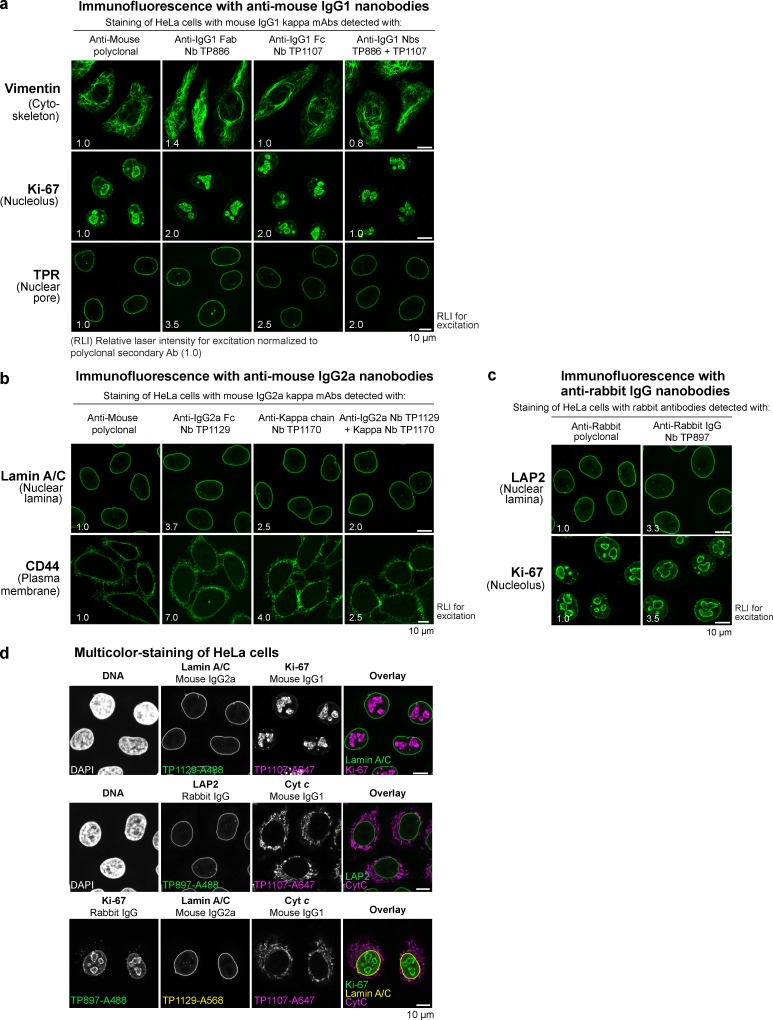
Imaging with anti-IgG nanobodies. (a) Immunofluorescence with anti–mouse IgG1 nanobodies. HeLa cells were stained with the indicated mouse IgG1 κ mAbs. These primary antibodies were then detected with Alexa Fluor 488–labeled goat anti-mouse polyclonal antibody, anti–mouse IgG1 Fab nanobody TP886, or anti–mouse IgG1 Fc nanobody TP1107. A combination of TP886 and TP1107 yielded increased staining intensities. Laser intensities used to acquire the anti-IgG nanobody images were normalized to the intensity used to acquire the anti-mouse polyclonal antibody image (RLI, relative laser intensity used for excitation under otherwise identical settings serves as a measure of fluorescence signal strength). (b) Immunofluorescence with anti–mouse IgG2a nanobodies. HeLa cells were stained with the indicated mouse IgG2a mAbs. These primary antibodies were then detected with Alexa Fluor 488–labeled goat anti-mouse polyclonal antibody, anti–mouse IgG2a Fc nanobody TP1129, or anti–κ chain nanobody TP1170. A combination of TP1129 and TP1170 yielded increased staining intensities. (c) Immunofluorescence with anti–rabbit IgG nanobody TP897. HeLa cells were stained with the indicated rabbit antibodies. These primary antibodies were then detected with Alexa Fluor 488–labeled goat anti-rabbit polyclonal antibody or anti–rabbit IgG nanobody TP897. (d) Multicolor staining of HeLa cells. HeLa cells were incubated with the indicated mouse IgG1, mouse IgG2a, or rabbit IgG antibodies. These primary antibodies were detected via anti–mouse IgG1 Fc nanobody TP1107, anti–mouse IgG2a Fc nanobody TP1129, or anti–rabbit IgG nanobody TP897, respectively, labeled with the indicated Alexa Fluor dyes. The top two panels show dual colocalization, and the bottom panel shows a triple colocalization.

