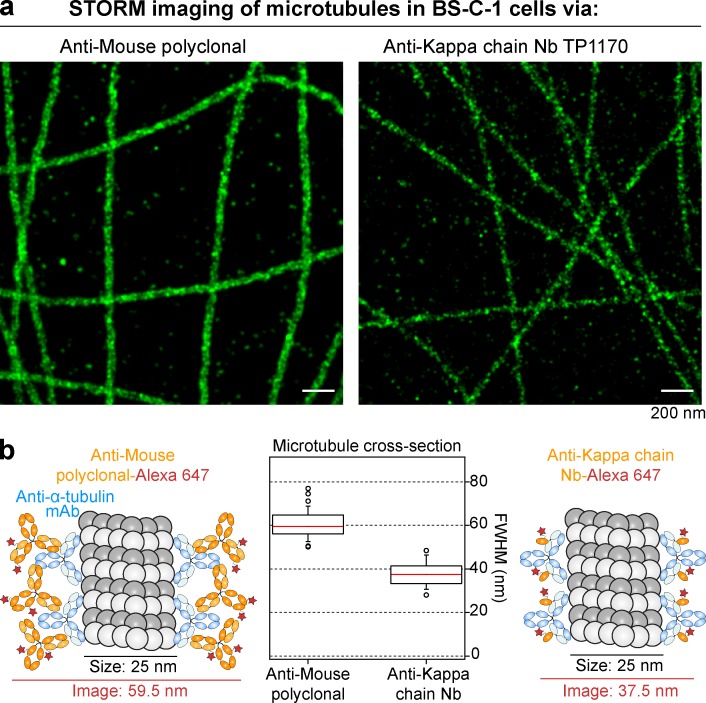
Figure 6.
STORM imaging with anti–κ chain nanobody TP1170. (a) BS-C-1 cells were stained with an anti–α tubulin monoclonal antibody (IgG1 κ) and detected with Alexa Fluor 647–labeled goat anti-mouse polyclonal antibody or Alexa Fluor 647–labeled anti–mouse κ chain nanobody TP1170. STORM images of the two samples show subdiffraction limit organization of the tubulin filaments. (b) To quantify the effect of the label size on the apparent width of the filaments in the STORM images, averaged cross-sectional profiles of straight segments of filaments from the two samples were measured. First, the two labeling approaches are illustrated on the left and right of the figure, showing the expected smaller width for the nanobody labeling case. In the middle, box plots illustrate the results of the width analysis (boxes indicate first and third quartiles of data values, whereas the red line indicates the median value; error bars indicate the 10th and 90th percentiles). In these measurements, the median width of the tubulin filaments decreased by a significant amount (from 59.5 to 37.5 nm) when stained with the anti–mouse κ chain nanobody TP1170.

