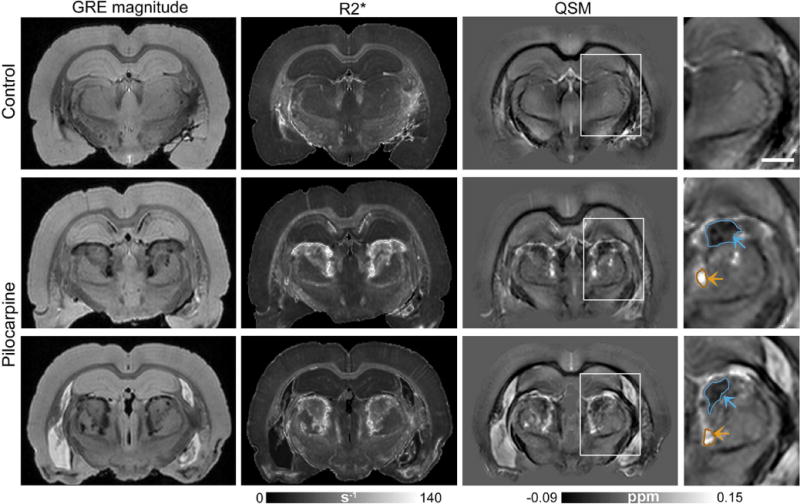
Figure 1.

Bilaterally-symmetric lesions in the thalamus of pilocarpine-treated rats delineated with GRE imaging. Coronal GRE magnitude (TE=15 ms), R2*, and quantitative susceptibility maps from a control rat (top row) and two representative pilocarpine-treated rats (middle, bottom rows) are shown. Bilateral thalamic lesions can be identified as hyperintense areas in the R2* maps. Magnified views of quantitative susceptibility maps in the right panel (corresponding to regions indicated by the white boxes) demonstrate distinct diamagnetic (blue arrows) and paramagnetic (orange arrows) areas delineated within the thalamic lesions. Scale bar: 1.5 mm.
