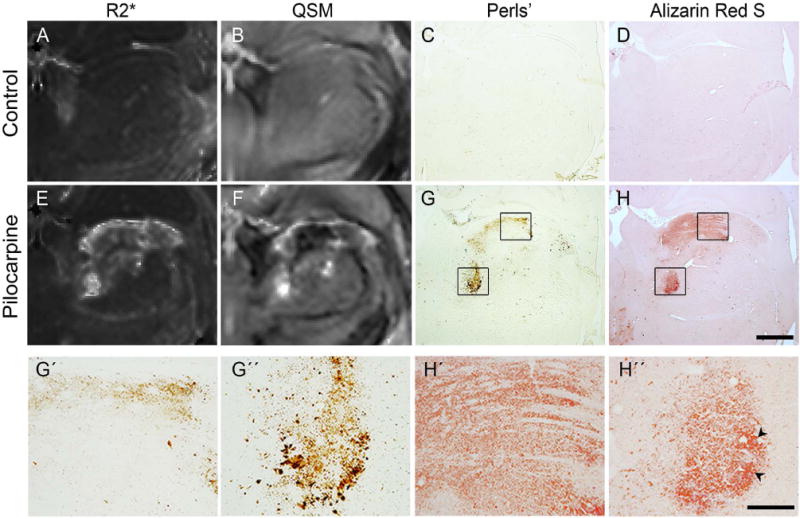
Figure 3.

Comparison of R2* and quantitative susceptibility maps through the thalamus of control (A, B) and pilocarpine-treated (E, F) rats with coronal Perls’ (iron) and Alizarin red S (calcium) stained sections from the same brains. Localized deposits of iron and calcium are seen in the pilocarpine-treated rat brain (G, H), which correspond closely to the paramagnetic and diamagnetic regions delineated in the susceptibility map (F). High-magnification views in panels G’-H’ and G”-H” (corresponding to areas within the black boxes in G, H) reveal microscopic granular iron and calcium deposits in select thalamic areas, with a few formed calcified crystals (black arrowheads). Scale bar for A-H: 1 mm, scale bar for G’-H”: 200 μm.
