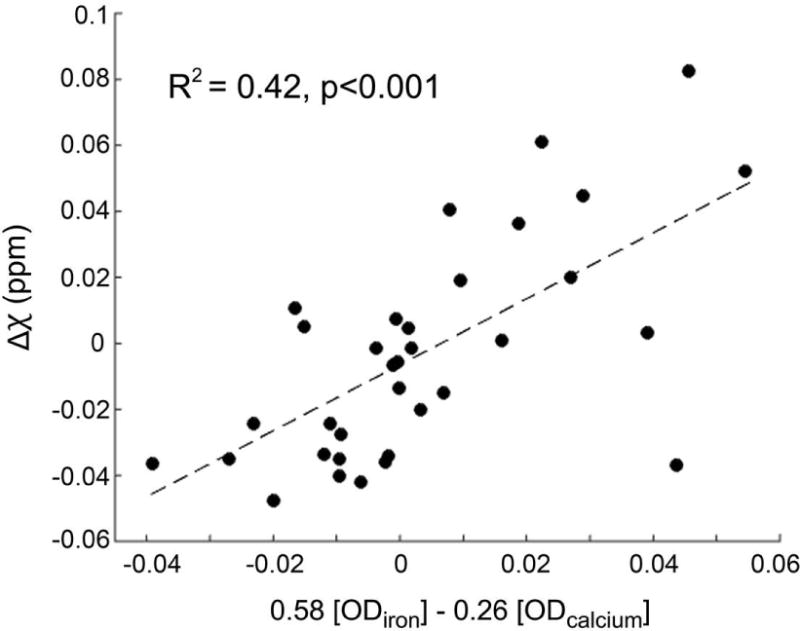
Figure 7.

Plot showing results of multiple regression analysis between susceptibility values (Δχ, referenced to cortical gray matter) and optical densities of iron and calcium in the thalamic lesions as measured from Perls’- and Alizarin red S-stained sections, respectively.
