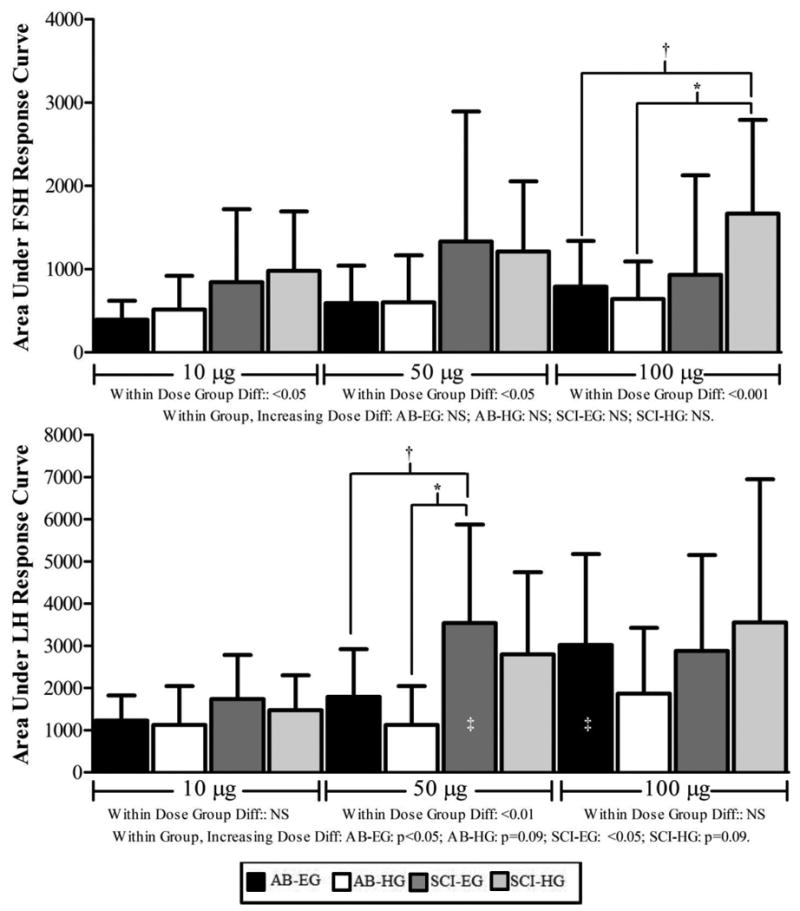
Figure 3.

FSH and LH area under the curve responses by dose of GnRH (e.g., 10 μg, 50 μg, 100 μg). Results are provided from the omnibus model to determine the presence of significant group differences within each GnRH dose for FSH (top panel) and LH (bottom panel). The dose of GnRH administered is provided beneath each set of bars. Post-hoc tests that revealed the presence of significant group differences within each dose and hormone (e.g., FSH or LH) are provided with brackets and the corresponding level of significance (*p<0.01, † p=0.07). Results from the omnibus model to determine the presence of significant AUC responses to GnRH dose within group are labeled beneath the FSH (top panel) and LH (bottom panel) graphical presentations. Post-hoc tests revealing the presence of significant increases in AUC responses for LH are provided on the corresponding bar against which the change occurred compared to the 10 μg dose (‡ p<0.05). NS= not significant; AB-EG= able-bodied eugonadal; AB-HG: able-bodied hypogonadal; SCI-EG: spinal cord injury eugonadal; SCI-HG: spinal cord injury hypogonadal.
