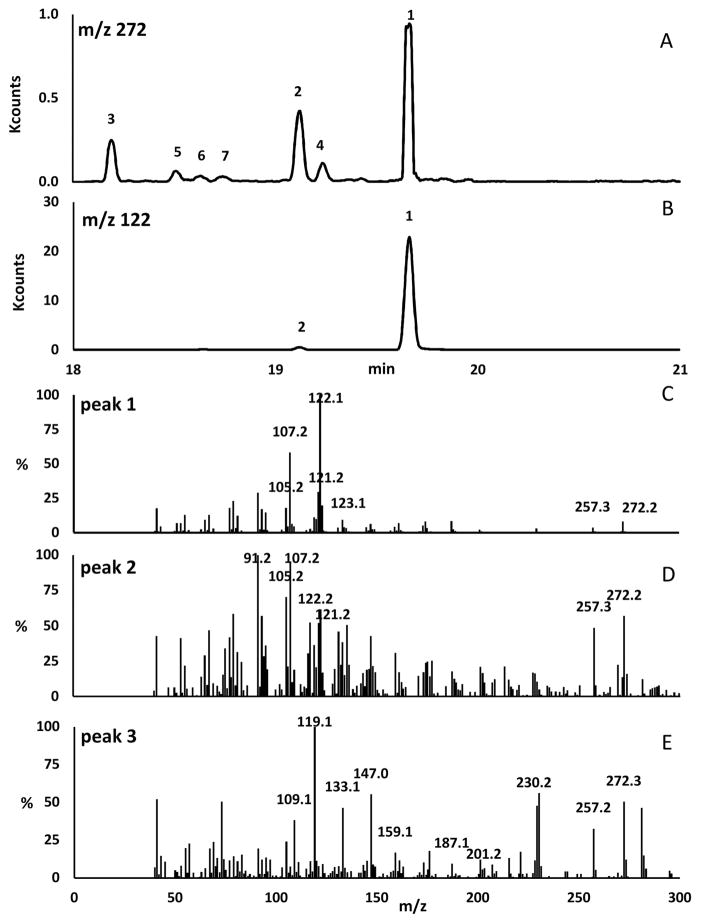
Fig. 2.
GC-MS analysis of diterpenes produced by E. coli expressing TS, GGPPS and MEP pathway enzymes. (A) Selective ion monitoring chromatogram at m/z 272; (B) Selective ion monitoring chromatogram at m/z 122; (C) Mass spectrum of peak 1 putatively identified as endotaxadiene; (D) Mass spectrum of peak 2 putatively identified as exotaxadiene; (E) Mass spectrum of peak 3 putatively identified as verticillene.

