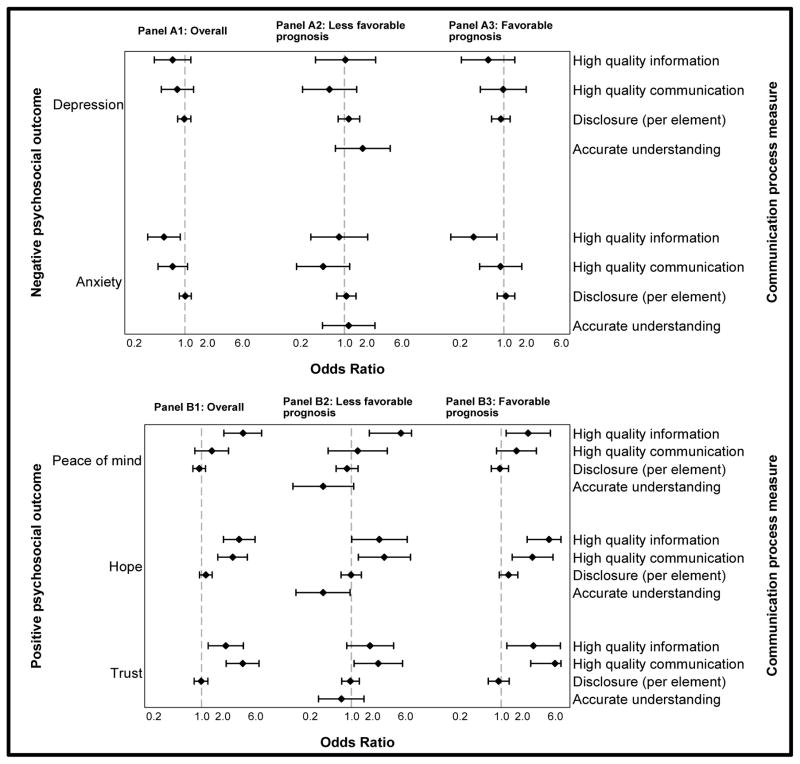
Figure 2.
Forest plot of adjusted odds ratios for the association between communication process measures and negative (Panel A) and positive (Panel B) psychosocial outcomes, stratified by prognosis. Panel 1: Overall cohort; Panel 2: Less favorable prognosis subset; Panel 3: Favorable Prognosis subset
Diamonds represent odds ratios and bars represent associated 95% confidence intervals, with upper bounds truncated at 7. Odds ratios adjusted for all communication process measures shown, plus site, child age, gender, and diagnosis; prognosis (for Panel A); and parent age, gender, race/ethnicity, education, and marital status. Within-physician clustering accounted for by generalized estimating equations (GEE).

