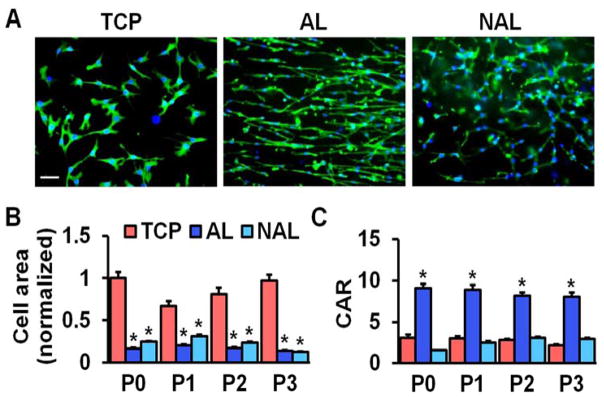
Figure 1.
MSC morphology when isolated and expanded on TCP, AL, or NAR scaffolds. (A) F-actin staining (green) and nuclear staining (blue), scale bar = 100 μm, normalized to mean cell area on TCP at passage 0 (P0), error bars indicate S.D. (B) Quantification of cell area and (C) cellular aspect ratio (CAR) as a function of passage number (n = ~55 cells, *: p<0.05 vs. TCP, two-way ANOVA with Fisher’s LSD, mean ± S.E.M).

