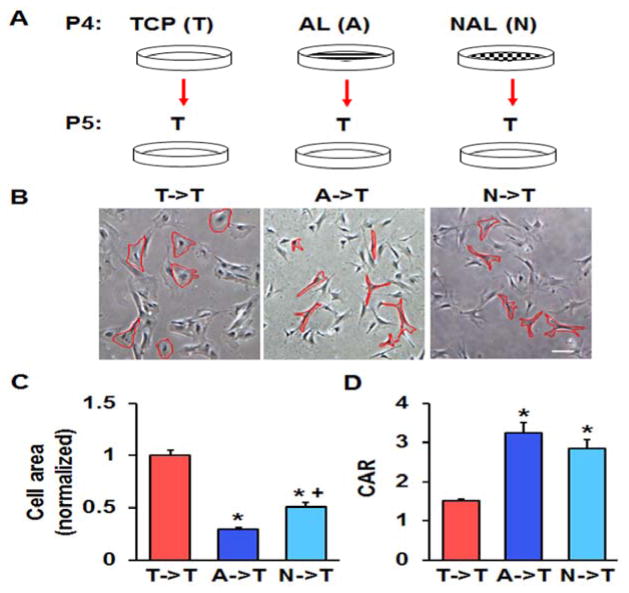
Figure 7.
Persistence of altered MSC phenotype after transfer to TCP. (A) Schematic of study design. (B) Bright-field images of P5 MSCs pre-cultured on TCP (T->T), AL (A->T), or NAL (N->T) scaffolds that were re-plated onto TCP (bar = 100 μm). (C) Quantification of cell area (normalized to area on TCP) and (C) cell aspect ratio (CAR) (n = ~50 cells, *: p<0.05 vs. T->T, +: p<0.05 vs A->T, one-way ANOVA with Fisher’s LSD, mean ± S.E.M.).

