
Figure 3.
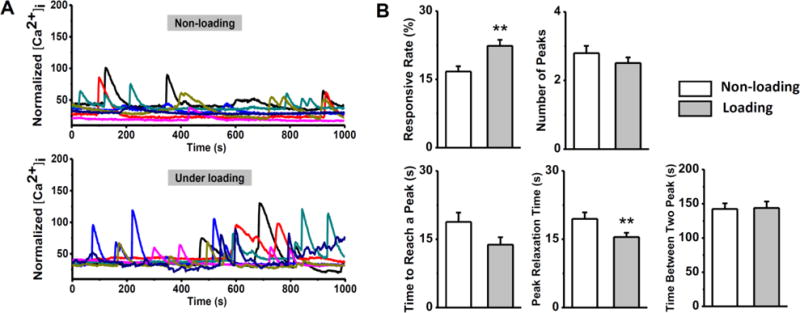
Comparison of [Ca2+]i signaling of in situ chondrocytes in the loaded and unloaded cartilage explants. (A) Typical [Ca2+]i intensity curves of chondrocytes in 1,000 seconds from the loaded and unloaded groups. Each curve represents the calcium transient of a single cell. A large number of chondrocytes can release multiple [Ca2+]i peaks in 1,000 seconds. (B) Percentage of chondrocytes showed [Ca2+]i peaks in loaded cartilage is significantly higher than the unloaded sample, while the average number of peaks in each responsive cell had no difference. Temporal parameters of [Ca2+]i peaks, including time to reach a peak, peak relaxation time, and time between two peaks are compared between two groups. *: P value < 0.05; **: P value < 0.01; and ***: P value < 0.001.