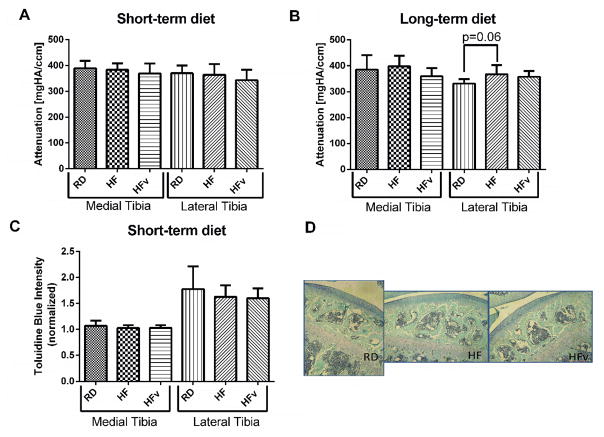
Figure 4.
A) Average attenuation value of articular cartilage from hexabrix enhanced microCT images in animals undergoing the 6 week diet/LIV protocol (n=10 for all groups) and in (B) animals undergoing the 6 month diet/LIV protocol (RD, n=7; HF, n=7, HFv, n=10). (C) Toluidine blue intensity measured in histological sections of articular cartilage, normalized to the staining intensity of the growth plate. (RD, n=7, HF, n=8, HFv, n=8) (D) Representative toluidine blue/fast green stained histological sections from RD, HF, and HFv groups. No difference in staining intensity was detected between groups.

