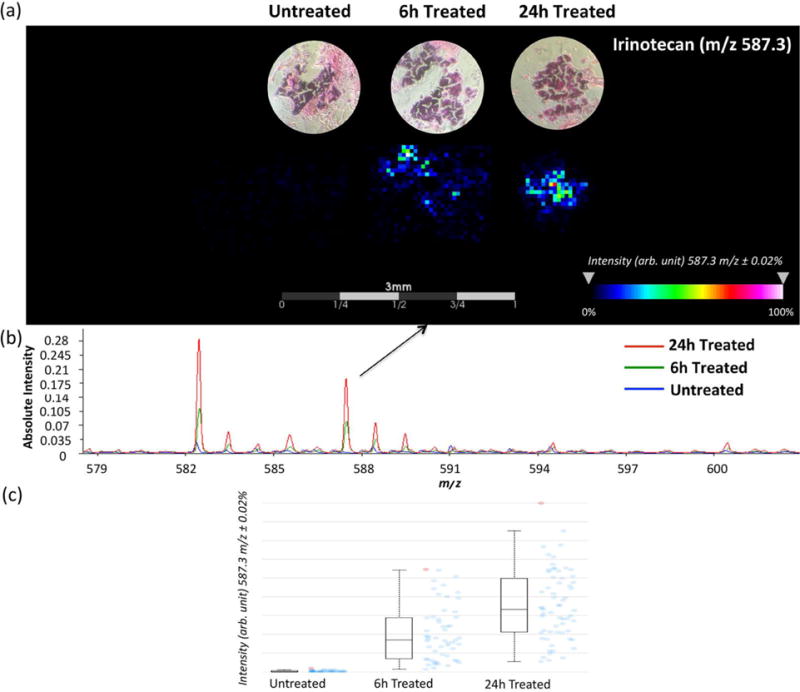
Figure 3.

MALDI-MSI ion intensity maps (a), summed mass spectra (b) and intensity box plots (c) of organoids treated with 20.6 μM irinotecan for 0 h, 6 h, and 24 h. Irinotecan is more abundant on the edge of organoids at the first 6 h, but fully penetrates the organoids after 24 h of treatment. The box plots shows a median intensity. Blue dots represent the spectra in which intensities of the given m/z interval is between the lower and upper quartiles, and red dots represent outliers.
