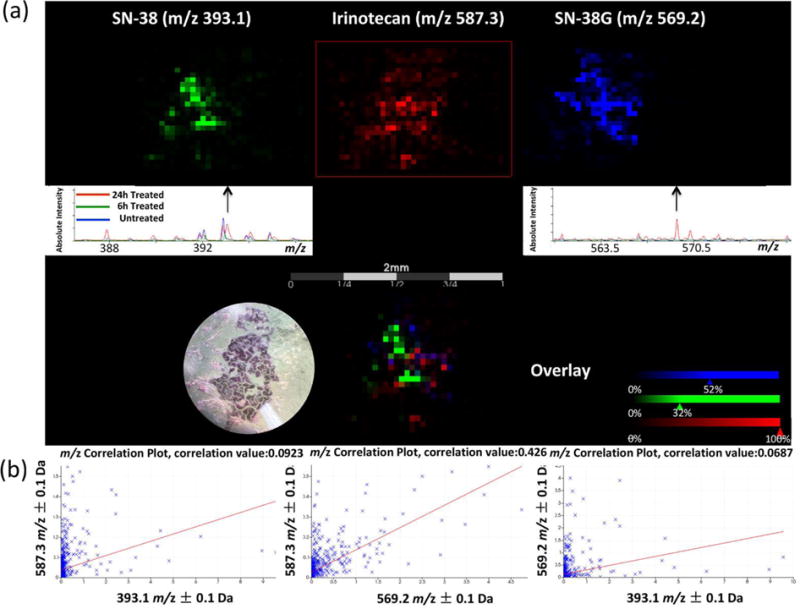
Figure 4.

Localization of irinotecan and its metabolites in a 24 h treated CTO. (a) MALDI-MSI ion images and summed spectra of distribution of irinotecan (m/z 587.3), SN-38 (m/z 393.1), and SN-38G (m/z 569.2). (b) Correlation analysis to evaluate co-localization of irinotecan and its metabolites in the CTO. The left plot shows the correlation of irinotecan (m/z 587.3) and SN-38 (m/z 393.1). The middle plot shows the correlation of irinotecan (m/z 587.3) and SN-38G (m/z 569.2). The right plot shows the correlation of SN-38G (m/z 569.2) and SN-38 (m/z 393.1).
