
Figure 3.
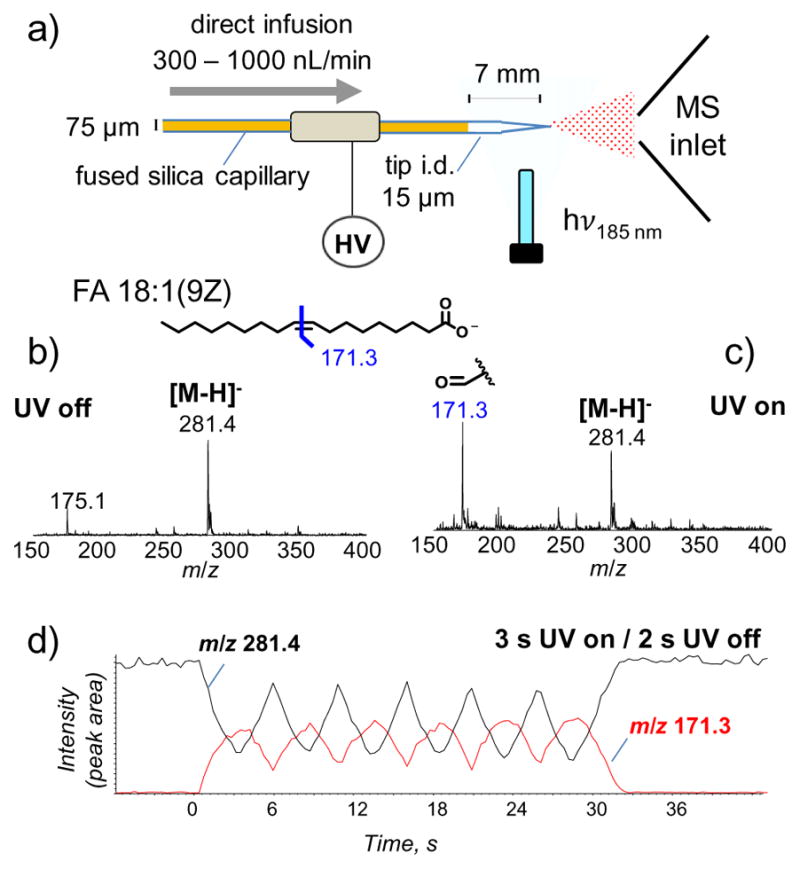
a) Schematics of the reaction setup for UV-lamp induced ozonolysis coupled with infusing nanoESI. Negative ion mode MS spectra of oleic acid (FA 18:1(9Z), 5 μM, dissolved in 7:3 ACN: H2O, 0.5% formic acid added) at 500 nL/min flow rate: b) before UV irradiation and c) after 2.5 s UV irradiation. d) XIC of intact oleic ion ([M-H]−, m/z 281.4) and deprotonated 9-oxo-nonanoic acid (m/z 171.3) with the lamp manually turned on for 3 s and off for 2 s sequentially.