
Figure 5.
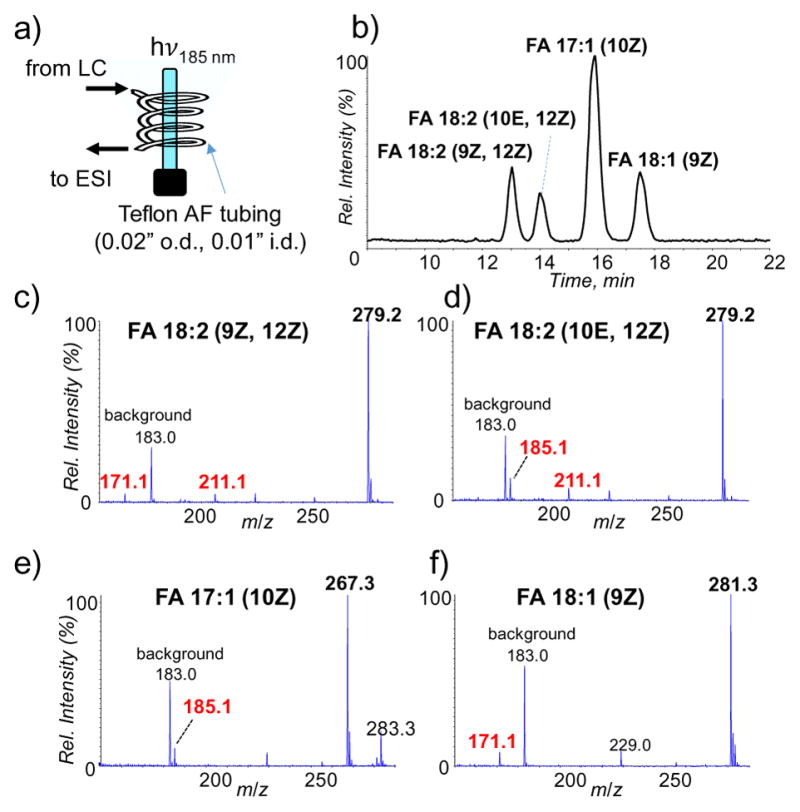
UV-lamp induced ozonolysis coupled online with LC-MS for fatty acid mixture analysis. (a) Cartoon depiction of the experimental setup. (b) Reversed-phase liquid chromatogram of four unsaturated fatty acids. ESI-MS spectra in negative ion mode of (c) FA 18:2 (9Z, 12Z), (d) FA 18:2 (10E, 12Z), (e) FA 17:1 (10Z) and (f) FA 18:1 (9Z) after online ozonolysis.