
Fig. 1.
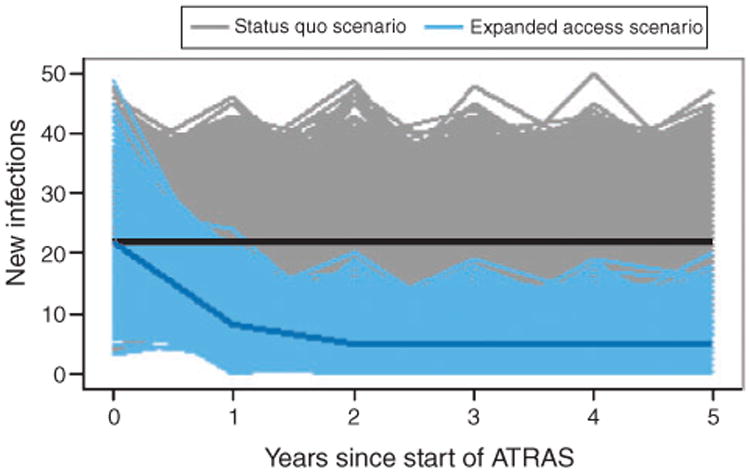
Annual number of new infections caused by HIV-positive (HIV+) temporary residents for each simulation. The grey lines represent the status quo scenario simulations, while the blue lines are for the expanded access scenario simulations (expansion of medical care and antiretroviral treatment (ART) to all temporary residents). The black and dark blue lines show the median number of new infections for the status quo and expanded access simulations respectively.