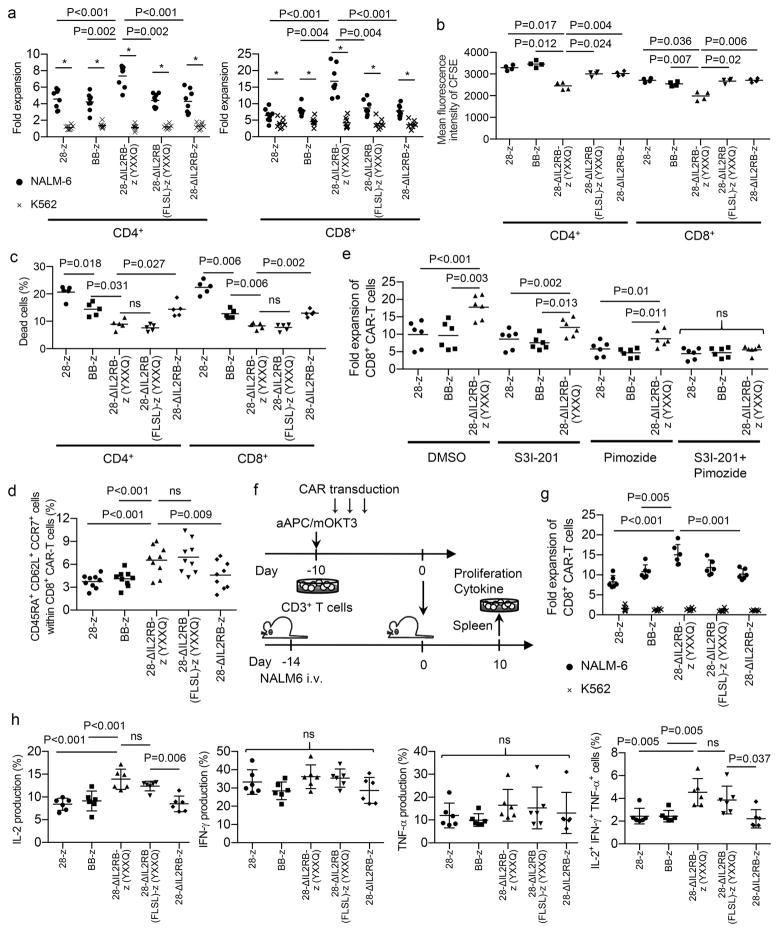
Fig. 2. The 28-ΔIL2RB-z (YXXQ) CAR-T cells show a superior proliferative capacity and maintain less differentiated memory T cell phenotypes following the antigen stimulation.
(a) The fold expansion of the CD4+ and CD8+ CAR-T cells was calculated 7 days after stimulation with NALM-6 or K562 (n=8; repeated measures one-way ANOVA with Tukey’s multiple comparisons test for the NALM-6 data, F=20.12 for CD4+ T cells, F=36.57 for CD8+ T cells, degree of freedom=39; paired t-test for comparison between the NALM-6 and K562 data in individual CAR-T cells, t=10.34 (CD4+-28-z), t=8.16 (CD4+-BB-z), t=13.98 (CD4+-28-ΔIL2RB-z (YXXQ)), t=10.26 (CD4+-28-ΔIL2RB (FLSL)-z (YXXQ)), t=6.33 (CD4+-28-ΔIL2RB-z), t=7.47 (CD8+-28-z), t=10.57 (CD8+-BB-z), t=9.88 (CD8+-28-ΔIL2RB-z (YXXQ)), t=12.63 (CD8+-28-ΔIL2RB (FLSL)-z (YXXQ)), t=7.44 (CD8+-28-ΔIL2RB-z), degree of freedom=7). (b) CAR-T cells were labeled with carboxyfluorescein succinimidyl ester (CFSE) and stimulated with NALM-6. The mean fluorescence intensity of CFSE was analyzed three days following the stimulation (n=4; repeated measures one-way ANOVA with Tukey’s multiple comparisons test; F=36.84 for CD4+ T cells, F=38.44 for CD8+ T cells; degree of freedom=19). (c) The frequency of dead cells within CD4+ or CD8+ CAR-T cell population was analyzed by flow cytometry 24 hours after stimulation with NALM-6 (n=4; repeated measures one-way ANOVA with Tukey’s multiple comparisons test; F=53.83 for CD4+ T cells, F=114.1 for CD8+ T cells; degree of freedom=24). (d) The frequency of CD45RA+ CD62L+ CCR7+ cells in the CD8+ CAR-T cell population 7 days after stimulation with NALM-6 (n=9; repeated measures one-way ANOVA with Tukey’s multiple comparisons test; F=14.35; degree of freedom=44). (e) CAR-transduced T cells were stimulated with NALM-6 and cultured with or without 25 μM of S3I-201 (STAT3 inhibitor) and/or 5 μM of pimozide (STAT5 inhibitor) for 3 days. The fold expansion of the CD8+ CAR-T cells was analyzed on day 7 (n=6, repeated measures one-way ANOVA with Tukey’s multiple comparisons test for each condition; F=46.52 for DMSO, F=15.67 for S3I-201, F=19.17 for pimozide, F=1.85 for S3I-201+pimozide; degree of freedom=17). In a–e, data were collected from different donor samples. Horizontal lines indicate mean values. (f–h) NOD-scid IL2rγnull (NSG) mice were intravenously infused with NALM-6 and subsequently transplanted with CAR-T cells. The spleen cells isolated from the mice were restimulated with NALM-6 (●) or K562 (x), and the fold expansion after 7 days of culture (g) and cytokine production (h) of CD8+ CAR-T cells were analyzed. The data shown are the sum of two independent experiments (n=6 mice for each group, ordinary one-way ANOVA with Tukey’s multiple comparisons test; F=10.85 for fold expansion, F=12.42 for IL-2, F=2.17 for IFN-γ, F=0.81 for TNF-α, F=7.51 for IL-2+ IFN-γ+ TNF-α+ cells, degree of freedom=29). In g and h, horizontal lines show mean values ± s.d. ns, not significant.

