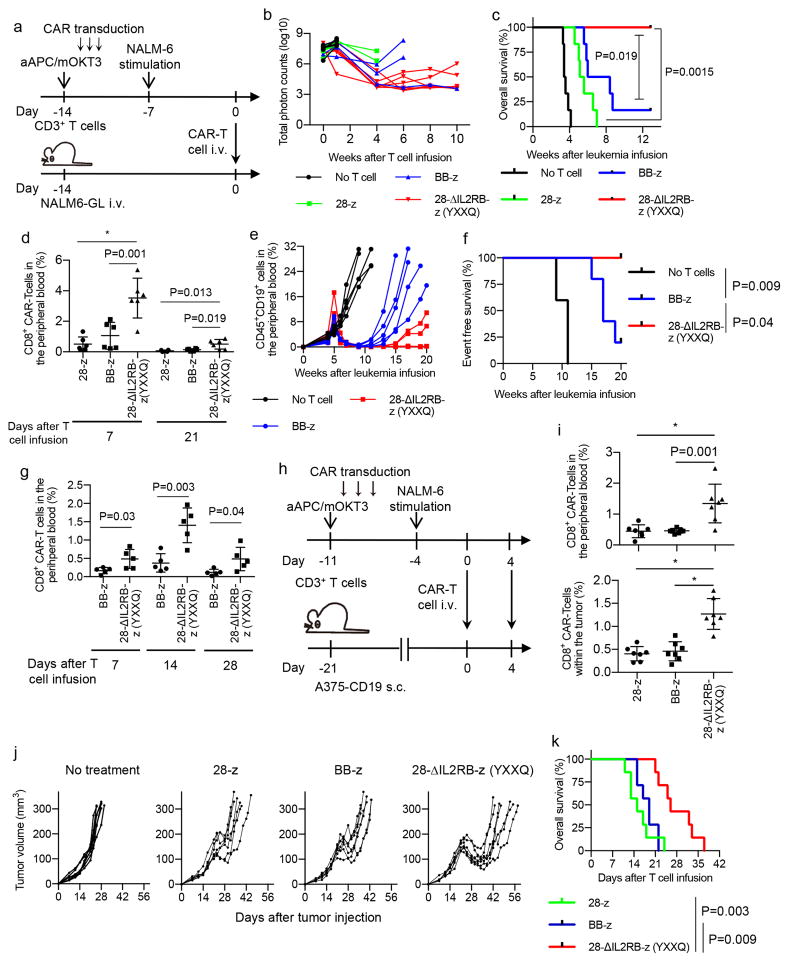
Fig. 4. T cells transduced with the 28-ΔIL2RB-z (YXXQ) CAR have superior antitumor effects in vivo.
(a–d) NOD-scid IL2rγnull (NSG) mice were intravenously infused with the NALM-6 transduced with EGFP-luciferase (NALM6-GL) (day −14) and were transplanted with 5×10⁶ CAR-T cells (day 0) (a). (b) The quantified total photon counts analyzed by in vivo bioluminescent imaging of the luciferase activity (n=6 mice for each group). (c, d) Kaplan–Meier curve for the overall survival of the mice (c, n=6; log-rank test; p values were adjusted with Bonferroni correction) and the frequency of CD8+ CAR-T cells in the peripheral blood (d, n=4 for 28-z on day 21, n=6 for the other groups; ordinary one-way ANOVA with Tukey’s multiple comparisons test; F=17.19, degree of freedom=17 for Day 7; F=7.42, degree of freedom=15 for Day 21). Representative data of two experiments are shown. (e–g) NSG mice were intravenously infused with the CD19+ primary acute lymphoblastic leukemia (ALL) cells (day −35) and adoptively transferred with 5×10⁵ BB-z or 28-ΔIL2RB-z (YXXQ) CAR-T cells (day 0). The serial monitoring of the CD45+ CD19+ ALL cells in the peripheral blood (e, n=5 mice for each group) and the Kaplan–Meier curve for the event-free survival of the mice are shown (f, n=5 for each group; log-rank test; p values were adjusted with Bonferroni correction). The frequency of the CD8+ CAR-T cells was analyzed in the peripheral blood on days 7, 14 and 28 (g; n=5, unpaired two-tailed t-test; t=2.58 for Day 7, t=4.28 for Day 14, t=2.46 for Day 21; degree of freedom=8). The data are representative of two experiments using different ALL samples. (h–k) NSG mice were subcutaneously injected with the melanoma cell line A375 transduced with CD19 (A375-CD19) (day −21), and treated with 5×10⁵ CAR-T cells on day 0 and 4. (i) The frequency of the CD8+ CAR-T cells in the peripheral blood and subcutaneous tumors on day 7 (n=7, ordinary one-way ANOVA with Tukey’s multiple comparisons test; F=12.61 for peripheral blood, F=27.46 for tumor; degree of freedom=20). The serial monitoring of tumor progression (j) and overall survival (k; n=7, log-rank test; p values were adjusted with Bonferroni correction) of the mice are shown. Representative results of two experiments. In d, g, and i, horizontal lines indicate mean values ± s.d. * P<0.001.

